
Hi,
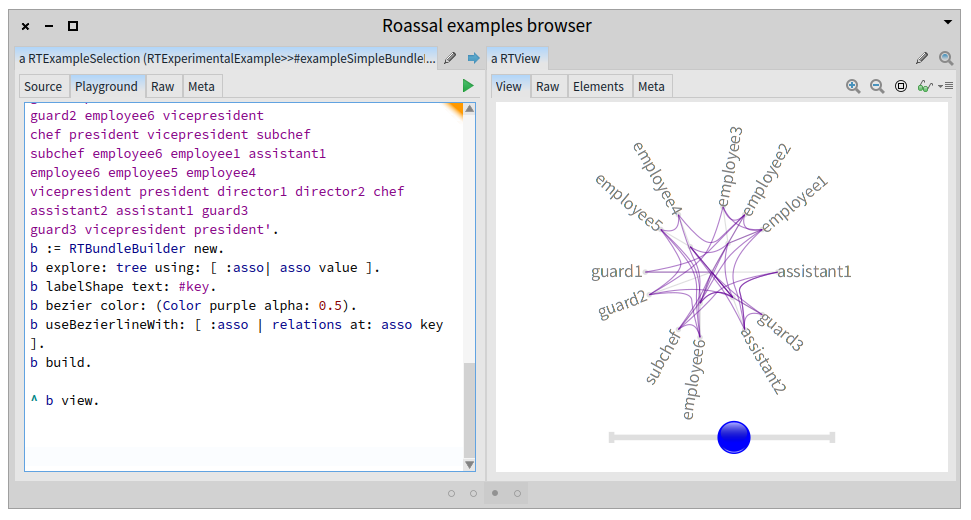
I'm trying to understand the code behind the figure here to rotate labels:
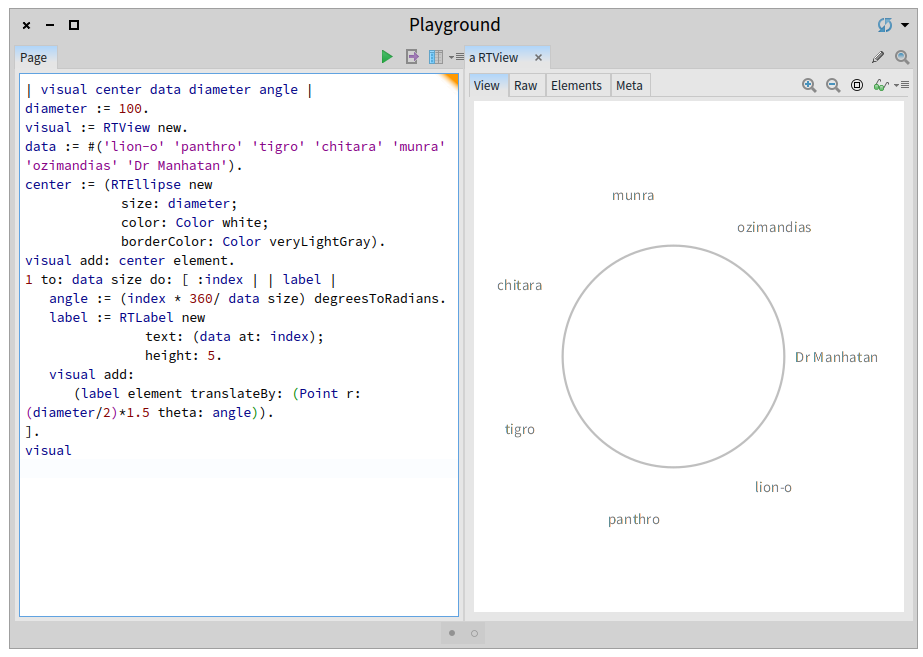
So, I made a minimal example to start with, here (code is at http://ws.stfx.eu/N6ZG4BAIBO00 )
Now I would like to rotate the text to made it look like the first image. I presume that the code that made this possible for the first case is this one:
==================== RTBundleBuilder>>createLabelFor: e view: aView | lbl | lbl := label elementOn: e model. self interaction setUpElement: lbl. aView add: lbl. e addCallback: (TRTranslationCallback new block: [ | angle | angle := (e position - center ) theta. lbl translateTo: e position+((lbl trachelShape notRotatedWidth/2) * (angle cos @ angle sin)). angle := angle radiansToDegrees. angle := angle + ((angle between: 90 and: 270) ifTrue: [ 180 ] ifFalse: [ 0 ]). lbl trachelShape angleInDegree: angle ] ). e translateTo: e position. ====================
but I can not quite understand the lines
lbl translateTo: e position+((lbl trachelShape notRotatedWidth/2) * (angle cos @ angle sin)).
and
angle := angle + ((angle between: 90 and: 270) ifTrue: [ 180 ] ifFalse: [ 0 ]).
Could some body explain me how to incorporate rotation to the first basic example at http://ws.stfx.eu/N6ZG4BAIBO00 (second image of this mail).
Thanks,
Offray

Hi Offray
Can you try the next piece of code.
.=.=.=.=.=.=.=.=.=.=.=.=.=.=.=.=.=.=.=.=.=.=.=.=.=.=.=.=.=.=.=.=.=.=.=.=.=.=.=.=.=.=.=.=.=.=.=.=.=.= | view center data diameter angle gap | diameter := 100. gap := 5. view := RTView new. data := #('lion-o' 'tigro' 'chitara' 'munra' 'ozimandias' 'Dr Manhatan').
center := RTEllipse new size: diameter; color: Color white; borderColor: Color veryLightGray. view add: center element. 1 to: data size do: [ :index | | label | angle := (index * 360/ data size) degreesToRadians. label := (RTRotatedLabel new text: (data at: index); height: 5) element. label translateBy: (Point r: label trachelShape notRotatedWidth/2+(diameter/2)+gap theta: angle). view add: label. angle := angle radiansToDegrees. angle := angle + ((angle between: 90 and: 270) ifTrue: [ 180 ] ifFalse: [ 0 ]). label trachelShape angleInDegree: angle. ]. view
.=.=.=.=.=.=.=.=.=.=.=.=.=.=.=.=.=.=.=.=.=.=.=.=.=.=.=.=.=.=.=.=.=.=.=.=.=.=.=.=.=.=.=.=.=.=.=.=.=.=
Cheers, Milton
2015-12-23 20:36 GMT-04:00 Offray Vladimir Luna Cárdenas < offray.luna@mutabit.com>:
Hi,
I'm trying to understand the code behind the figure here to rotate labels:
So, I made a minimal example to start with, here (code is at http://ws.stfx.eu/N6ZG4BAIBO00 )
Now I would like to rotate the text to made it look like the first image. I presume that the code that made this possible for the first case is this one:
==================== RTBundleBuilder>>createLabelFor: e view: aView | lbl | lbl := label elementOn: e model. self interaction setUpElement: lbl. aView add: lbl. e addCallback: (TRTranslationCallback new block: [ | angle | angle := (e position - center ) theta. lbl translateTo: e position+((lbl trachelShape notRotatedWidth/2)
- (angle cos @ angle sin)). angle := angle radiansToDegrees. angle := angle + ((angle between: 90 and: 270) ifTrue: [ 180 ]
ifFalse: [ 0 ]). lbl trachelShape angleInDegree: angle ] ). e translateTo: e position. ====================
but I can not quite understand the lines
lbl translateTo: e position+((lbl trachelShape notRotatedWidth/2) * (angle cos @ angle sin)).
and
angle := angle + ((angle between: 90 and: 270) ifTrue: [ 180 ] ifFalse: [ 0 ]).
Could some body explain me how to incorporate rotation to the first basic example at http://ws.stfx.eu/N6ZG4BAIBO00 (second image of this mail).
Thanks,
Offray
Moose-dev mailing list Moose-dev@list.inf.unibe.ch https://www.list.inf.unibe.ch/listinfo/moose-dev
Thanks Milton!
It works like a charm :-)
Cheers,
Offray
On 24/12/15 10:01, milton mamani wrote:
Hi Offray
Can you try the next piece of code.
.=.=.=.=.=.=.=.=.=.=.=.=.=.=.=.=.=.=.=.=.=.=.=.=.=.=.=.=.=.=.=.=.=.=.=.=.=.=.=.=.=.=.=.=.=.=.=.=.=.= | view center data diameter angle gap | diameter := 100. gap := 5. view := RTView new. data := #('lion-o' 'tigro' 'chitara' 'munra' 'ozimandias' 'Dr Manhatan').
center := RTEllipse new size: diameter; color: Color white; borderColor: Color veryLightGray. view add: center element. 1 to: data size do: [ :index | | label | angle := (index * 360/ data size) degreesToRadians. label := (RTRotatedLabel new text: (data at: index); height: 5) element. label translateBy: (Point r: label trachelShape notRotatedWidth/2+(diameter/2)+gap theta: angle). view add: label. angle := angle radiansToDegrees. angle := angle + ((angle between: 90 and: 270) ifTrue: [ 180 ] ifFalse: [ 0 ]). label trachelShape angleInDegree: angle. ]. view
.=.=.=.=.=.=.=.=.=.=.=.=.=.=.=.=.=.=.=.=.=.=.=.=.=.=.=.=.=.=.=.=.=.=.=.=.=.=.=.=.=.=.=.=.=.=.=.=.=.=
Cheers, Milton
2015-12-23 20:36 GMT-04:00 Offray Vladimir Luna Cárdenas <offray.luna@mutabit.com mailto:offray.luna@mutabit.com>:
Hi,

I'm trying to understand the code behind the figure here to rotate
labels:


So, I made a minimal example to start with, here (code is at
http://ws.stfx.eu/N6ZG4BAIBO00 )


Now I would like to rotate the text to made it look like the first
image. I presume that the code that made this possible for the
first case is this one:


====================
RTBundleBuilder>>createLabelFor: e view: aView
    | lbl |
    lbl := label elementOn: e model.
    self interaction setUpElement: lbl.
    aView add: lbl.
    e addCallback: (TRTranslationCallback new block: [
        | angle |
        angle := (e position - center ) theta.
        lbl translateTo: e position+((lbl trachelShape
notRotatedWidth/2) * (angle cos @ angle sin)).
        angle := angle radiansToDegrees.
        angle := angle + ((angle between: 90 and: 270) ifTrue: [
180 ] ifFalse: [ 0 ]).
        lbl trachelShape angleInDegree: angle ] ).
    e translateTo: e position.
====================

but I can not quite understand the lines

lbl translateTo: e position+((lbl trachelShape notRotatedWidth/2)
* (angle cos @ angle sin)).

and

angle := angle + ((angle between: 90 and: 270)  ifTrue: [ 180 ]
ifFalse: [ 0 ]).

Could some body explain me how to incorporate rotation to the
first basic example at http://ws.stfx.eu/N6ZG4BAIBO00 (second
image of this mail).

Thanks,

Offray

_______________________________________________
Moose-dev mailing list
Moose-dev@list.inf.unibe.ch <mailto:Moose-dev@list.inf.unibe.ch>
https://www.list.inf.unibe.ch/listinfo/moose-dev
Moose-dev mailing list Moose-dev@list.inf.unibe.ch https://www.list.inf.unibe.ch/listinfo/moose-dev

Excellent
Alex
Le 24 déc. 2015 à 14:08, Offray Vladimir Luna Cárdenas offray.luna@mutabit.com a écrit :
Thanks Milton!
It works like a charm :-)
<dgiafiic.>
Cheers,
Offray
On 24/12/15 10:01, milton mamani wrote: Hi Offray
Can you try the next piece of code.
.=.=.=.=.=.=.=.=.=.=.=.=.=.=.=.=.=.=.=.=.=.=.=.=.=.=.=.=.=.=.=.=.=.=.=.=.=.=.=.=.=.=.=.=.=.=.=.=.=.= | view center data diameter angle gap | diameter := 100. gap := 5. view := RTView new. data := #('lion-o' 'tigro' 'chitara' 'munra' 'ozimandias' 'Dr Manhatan').
center := RTEllipse new size: diameter; color: Color white; borderColor: Color veryLightGray. view add: center element. 1 to: data size do: [ :index | | label | angle := (index * 360/ data size) degreesToRadians. label := (RTRotatedLabel new text: (data at: index); height: 5) element. label translateBy: (Point r: label trachelShape notRotatedWidth/2+(diameter/2)+gap theta: angle). view add: label. angle := angle radiansToDegrees. angle := angle + ((angle between: 90 and: 270) ifTrue: [ 180 ] ifFalse: [ 0 ]). label trachelShape angleInDegree: angle. ]. view
.=.=.=.=.=.=.=.=.=.=.=.=.=.=.=.=.=.=.=.=.=.=.=.=.=.=.=.=.=.=.=.=.=.=.=.=.=.=.=.=.=.=.=.=.=.=.=.=.=.=
Cheers, Milton
2015-12-23 20:36 GMT-04:00 Offray Vladimir Luna Cárdenas offray.luna@mutabit.com:
Hi,
I'm trying to understand the code behind the figure here to rotate labels:
<mime-attachment.png>
So, I made a minimal example to start with, here (code is at http://ws.stfx.eu/N6ZG4BAIBO00 )
<mime-attachment.png>
Now I would like to rotate the text to made it look like the first image. I presume that the code that made this possible for the first case is this one:
==================== RTBundleBuilder>>createLabelFor: e view: aView | lbl | lbl := label elementOn: e model. self interaction setUpElement: lbl. aView add: lbl. e addCallback: (TRTranslationCallback new block: [ | angle | angle := (e position - center ) theta. lbl translateTo: e position+((lbl trachelShape notRotatedWidth/2) * (angle cos @ angle sin)). angle := angle radiansToDegrees. angle := angle + ((angle between: 90 and: 270) ifTrue: [ 180 ] ifFalse: [ 0 ]). lbl trachelShape angleInDegree: angle ] ). e translateTo: e position. ====================
but I can not quite understand the lines
lbl translateTo: e position+((lbl trachelShape notRotatedWidth/2) * (angle cos @ angle sin)).
and
angle := angle + ((angle between: 90 and: 270) ifTrue: [ 180 ] ifFalse: [ 0 ]).
Could some body explain me how to incorporate rotation to the first basic example at http://ws.stfx.eu/N6ZG4BAIBO00 (second image of this mail).
Thanks,
Offray
Moose-dev mailing list Moose-dev@list.inf.unibe.ch https://www.list.inf.unibe.ch/listinfo/moose-dev
Moose-dev mailing list Moose-dev@list.inf.unibe.ch https://www.list.inf.unibe.ch/listinfo/moose-dev
Moose-dev mailing list Moose-dev@list.inf.unibe.ch https://www.list.inf.unibe.ch/listinfo/moose-dev
Hi,
**Important Disclaimer**: Please consider this an alpha draft. Information depicted is not yet verified or the final one.
Here is the last version of this:
Still we need to explain color conventions (nothing difficult), but the matrix sunburst plus rotated labels (+ color conventions) is a concise way for having a quick overview of what's happening on information of considerable size. The interactive matrix sunburst lets the user to put the mouse over a particular part of the grid and obtain some details. The idea was to visualize gaps or absences of information (with the color white), and who and what is being publishing (or not) in the case of some drugs and medicines.
Despite of being public information, is sensible one, so we need to triple check everything before releasing the data (specially that labels correspond the the labeled columns! and that all is consistent). My friend, who is the domain expert on drugs and medicine is now taking her end of year vacations, but she is willing to put data and visualizations released as open research. Code has been published already on Smalltalkhub under the DataViz project, but we plan to release code, data, and maybe some small companion grafoscopio notebook integrating both, to make complete sense of the package.
As soon as I have the details worked out, I plan to blog about how agile visualization and Roassal can help in building specific domain visualizations, used in this case for understanding health information publishing issues.
This is a small preview of how interactive documentation, data visualization and open science & research have a fertile landscape in the Pharo ecosystem.
I will let you know how this advances and, as always, thanks for all the help.
Offray
On 24/12/15 17:13, Alexandre Bergel wrote:
Excellent
Alex
Le 24 déc. 2015 à 14:08, Offray Vladimir Luna Cárdenas <offray.luna@mutabit.com mailto:offray.luna@mutabit.com> a écrit :
Thanks Milton!
It works like a charm :-)
<dgiafiic.>
Cheers,
Offray
On 24/12/15 10:01, milton mamani wrote:
Hi Offray
Can you try the next piece of code.
.=.=.=.=.=.=.=.=.=.=.=.=.=.=.=.=.=.=.=.=.=.=.=.=.=.=.=.=.=.=.=.=.=.=.=.=.=.=.=.=.=.=.=.=.=.=.=.=.=.= | view center data diameter angle gap | diameter := 100. gap := 5. view := RTView new. data := #('lion-o' 'tigro' 'chitara' 'munra' 'ozimandias' 'Dr Manhatan').
center := RTEllipse new size: diameter; color: Color white; borderColor: Color veryLightGray. view add: center element. 1 to: data size do: [ :index | | label | angle := (index * 360/ data size) degreesToRadians. label := (RTRotatedLabel new text: (data at: index); height: 5) element. label translateBy: (Point r: label trachelShape notRotatedWidth/2+(diameter/2)+gap theta: angle). view add: label. angle := angle radiansToDegrees. angle := angle + ((angle between: 90 and: 270) ifTrue: [ 180 ] ifFalse: [ 0 ]). label trachelShape angleInDegree: angle. ]. view
.=.=.=.=.=.=.=.=.=.=.=.=.=.=.=.=.=.=.=.=.=.=.=.=.=.=.=.=.=.=.=.=.=.=.=.=.=.=.=.=.=.=.=.=.=.=.=.=.=.=
Cheers, Milton
2015-12-23 20:36 GMT-04:00 Offray Vladimir Luna Cárdenas offray.luna@mutabit.com:
Hi,

I'm trying to understand the code behind the figure here to
rotate labels:

<mime-attachment.png>

So, I made a minimal example to start with, here (code is at
http://ws.stfx.eu/N6ZG4BAIBO00 )

<mime-attachment.png>

Now I would like to rotate the text to made it look like the
first image. I presume that the code that made this possible for
the first case is this one:


====================
RTBundleBuilder>>createLabelFor: e view: aView
    | lbl |
    lbl := label elementOn: e model.
    self interaction setUpElement: lbl.
    aView add: lbl.
    e addCallback: (TRTranslationCallback new block: [
        | angle |
        angle := (e position - center ) theta.
        lbl translateTo: e position+((lbl trachelShape
notRotatedWidth/2) * (angle cos @ angle sin)).
        angle := angle radiansToDegrees.
        angle := angle + ((angle between: 90 and: 270)  ifTrue:
[ 180 ] ifFalse: [ 0 ]).
        lbl trachelShape angleInDegree: angle ] ).
    e translateTo: e position.
====================

but I can not quite understand the lines

lbl translateTo: e position+((lbl trachelShape
notRotatedWidth/2) * (angle cos @ angle sin)).

and

angle := angle + ((angle between: 90 and: 270) ifTrue: [ 180 ]
ifFalse: [ 0 ]).

Could some body explain me how to incorporate rotation to the
first basic example at http://ws.stfx.eu/N6ZG4BAIBO00 (second
image of this mail).

Thanks,

Offray

_______________________________________________
Moose-dev mailing list
Moose-dev@list.inf.unibe.ch <mailto:Moose-dev@list.inf.unibe.ch>
https://www.list.inf.unibe.ch/listinfo/moose-dev
Moose-dev mailing list Moose-dev@list.inf.unibe.ch https://www.list.inf.unibe.ch/listinfo/moose-dev
Moose-dev mailing list Moose-dev@list.inf.unibe.ch mailto:Moose-dev@list.inf.unibe.ch https://www.list.inf.unibe.ch/listinfo/moose-dev
Moose-dev mailing list Moose-dev@list.inf.unibe.ch https://www.list.inf.unibe.ch/listinfo/moose-dev

Hi Offray,
Beautiful work.
I like how you used unsaturated colors. Just a couple of notes: - I would try to use a more distinct set of colors for the rings that take more space. For example, the orange from the outmost ring is almost the same as the fourth one. For example, you have not yet used a green based color. Of course, this is if there isn’t a predefined meaning. - instead of the gray grid, I would use a plain white (or even transparent). This would still allow enough distinction with less energy. This would also create less confusion when using gray as colors for data. Right now, the two gray rings look more like something is disabled, or not applicable.
We still have to look at the code, but this is a significant piece of work that shows how you have come a long way in such a short amount of time. It would be great to have this as a builder in Roassal. Thank you for your contribution!
Cheers, Doru
On Jan 3, 2016, at 4:10 AM, Offray Vladimir Luna Cárdenas offray.luna@mutabit.com wrote:
Hi,
**Important Disclaimer**: Please consider this an alpha draft. Information depicted is not yet verified or the final one.
Here is the last version of this:
<jihifeci..png> Still we need to explain color conventions (nothing difficult), but the matrix sunburst plus rotated labels (+ color conventions) is a concise way for having a quick overview of what's happening on information of considerable size. The interactive matrix sunburst lets the user to put the mouse over a particular part of the grid and obtain some details. The idea was to visualize gaps or absences of information (with the color white), and who and what is being publishing (or not) in the case of some drugs and medicines.
Despite of being public information, is sensible one, so we need to triple check everything before releasing the data (specially that labels correspond the the labeled columns! and that all is consistent). My friend, who is the domain expert on drugs and medicine is now taking her end of year vacations, but she is willing to put data and visualizations released as open research. Code has been published already on Smalltalkhub under the DataViz project, but we plan to release code, data, and maybe some small companion grafoscopio notebook integrating both, to make complete sense of the package.
As soon as I have the details worked out, I plan to blog about how agile visualization and Roassal can help in building specific domain visualizations, used in this case for understanding health information publishing issues.
This is a small preview of how interactive documentation, data visualization and open science & research have a fertile landscape in the Pharo ecosystem.
I will let you know how this advances and, as always, thanks for all the help.
Offray
On 24/12/15 17:13, Alexandre Bergel wrote:
Excellent
Alex
Le 24 déc. 2015 à 14:08, Offray Vladimir Luna Cárdenas offray.luna@mutabit.com a écrit :
Thanks Milton!
It works like a charm :-)
<dgiafiic.>
Cheers,
Offray
On 24/12/15 10:01, milton mamani wrote:
Hi Offray
Can you try the next piece of code.
.=.=.=.=.=.=.=.=.=.=.=.=.=.=.=.=.=.=.=.=.=.=.=.=.=.=.=.=.=.=.=.=.=.=.=.=.=.=.=.=.=.=.=.=.=.=.=.=.=.= | view center data diameter angle gap | diameter := 100. gap := 5. view := RTView new. data := #('lion-o' 'tigro' 'chitara' 'munra' 'ozimandias' 'Dr Manhatan').
center := RTEllipse new size: diameter; color: Color white; borderColor: Color veryLightGray. view add: center element. 1 to: data size do: [ :index | | label | angle := (index * 360/ data size) degreesToRadians. label := (RTRotatedLabel new text: (data at: index); height: 5) element. label translateBy: (Point r: label trachelShape notRotatedWidth/2+(diameter/2)+gap theta: angle). view add: label. angle := angle radiansToDegrees. angle := angle + ((angle between: 90 and: 270) ifTrue: [ 180 ] ifFalse: [ 0 ]). label trachelShape angleInDegree: angle. ]. view
.=.=.=.=.=.=.=.=.=.=.=.=.=.=.=.=.=.=.=.=.=.=.=.=.=.=.=.=.=.=.=.=.=.=.=.=.=.=.=.=.=.=.=.=.=.=.=.=.=.=
Cheers, Milton
2015-12-23 20:36 GMT-04:00 Offray Vladimir Luna Cárdenas offray.luna@mutabit.com: Hi,
I'm trying to understand the code behind the figure here to rotate labels:
<mime-attachment.png>
So, I made a minimal example to start with, here (code is at http://ws.stfx.eu/N6ZG4BAIBO00 )
<mime-attachment.png>
Now I would like to rotate the text to made it look like the first image. I presume that the code that made this possible for the first case is this one:
==================== RTBundleBuilder>>createLabelFor: e view: aView | lbl | lbl := label elementOn: e model. self interaction setUpElement: lbl. aView add: lbl. e addCallback: (TRTranslationCallback new block: [ | angle | angle := (e position - center ) theta. lbl translateTo: e position+((lbl trachelShape notRotatedWidth/2) * (angle cos @ angle sin)). angle := angle radiansToDegrees. angle := angle + ((angle between: 90 and: 270) ifTrue: [ 180 ] ifFalse: [ 0 ]). lbl trachelShape angleInDegree: angle ] ). e translateTo: e position. ====================
but I can not quite understand the lines
lbl translateTo: e position+((lbl trachelShape notRotatedWidth/2) * (angle cos @ angle sin)).
and
angle := angle + ((angle between: 90 and: 270) ifTrue: [ 180 ] ifFalse: [ 0 ]).
Could some body explain me how to incorporate rotation to the first basic example at http://ws.stfx.eu/N6ZG4BAIBO00 (second image of this mail).
Thanks,
Offray
Moose-dev mailing list Moose-dev@list.inf.unibe.ch https://www.list.inf.unibe.ch/listinfo/moose-dev
Moose-dev mailing list
Moose-dev@list.inf.unibe.ch https://www.list.inf.unibe.ch/listinfo/moose-dev
Moose-dev mailing list Moose-dev@list.inf.unibe.ch https://www.list.inf.unibe.ch/listinfo/moose-dev
Moose-dev mailing list
Moose-dev@list.inf.unibe.ch https://www.list.inf.unibe.ch/listinfo/moose-dev
Moose-dev mailing list Moose-dev@list.inf.unibe.ch https://www.list.inf.unibe.ch/listinfo/moose-dev
-- www.tudorgirba.com www.feenk.com
"What is more important: To be happy, or to make happy?"
+1
On Jan 3, 2016, at 3:57 AM, Tudor Girba tudor@tudorgirba.com wrote:
Hi Offray,
Beautiful work.
I like how you used unsaturated colors. Just a couple of notes:
- I would try to use a more distinct set of colors for the rings that take more space. For example, the orange from the outmost ring is almost the same as the fourth one. For example, you have not yet used a green based color. Of course, this is if there isn’t a predefined meaning.
- instead of the gray grid, I would use a plain white (or even transparent). This would still allow enough distinction with less energy. This would also create less confusion when using gray as colors for data. Right now, the two gray rings look more like something is disabled, or not applicable.
We still have to look at the code, but this is a significant piece of work that shows how you have come a long way in such a short amount of time. It would be great to have this as a builder in Roassal. Thank you for your contribution!
Cheers, Doru
On Jan 3, 2016, at 4:10 AM, Offray Vladimir Luna Cárdenas offray.luna@mutabit.com wrote:
Hi,
**Important Disclaimer**: Please consider this an alpha draft. Information depicted is not yet verified or the final one.
Here is the last version of this:
<jihifeci..png> Still we need to explain color conventions (nothing difficult), but the matrix sunburst plus rotated labels (+ color conventions) is a concise way for having a quick overview of what's happening on information of considerable size. The interactive matrix sunburst lets the user to put the mouse over a particular part of the grid and obtain some details. The idea was to visualize gaps or absences of information (with the color white), and who and what is being publishing (or not) in the case of some drugs and medicines.
Despite of being public information, is sensible one, so we need to triple check everything before releasing the data (specially that labels correspond the the labeled columns! and that all is consistent). My friend, who is the domain expert on drugs and medicine is now taking her end of year vacations, but she is willing to put data and visualizations released as open research. Code has been published already on Smalltalkhub under the DataViz project, but we plan to release code, data, and maybe some small companion grafoscopio notebook integrating both, to make complete sense of the package.
As soon as I have the details worked out, I plan to blog about how agile visualization and Roassal can help in building specific domain visualizations, used in this case for understanding health information publishing issues.
This is a small preview of how interactive documentation, data visualization and open science & research have a fertile landscape in the Pharo ecosystem.
I will let you know how this advances and, as always, thanks for all the help.
Offray
On 24/12/15 17:13, Alexandre Bergel wrote:
Excellent
Alex
Le 24 déc. 2015 à 14:08, Offray Vladimir Luna Cárdenas offray.luna@mutabit.com a écrit :
Thanks Milton!
It works like a charm :-)
<dgiafiic.>
Cheers,
Offray
On 24/12/15 10:01, milton mamani wrote:
Hi Offray
Can you try the next piece of code.
.=.=.=.=.=.=.=.=.=.=.=.=.=.=.=.=.=.=.=.=.=.=.=.=.=.=.=.=.=.=.=.=.=.=.=.=.=.=.=.=.=.=.=.=.=.=.=.=.=.= | view center data diameter angle gap | diameter := 100. gap := 5. view := RTView new. data := #('lion-o' 'tigro' 'chitara' 'munra' 'ozimandias' 'Dr Manhatan').
center := RTEllipse new size: diameter; color: Color white; borderColor: Color veryLightGray. view add: center element. 1 to: data size do: [ :index | | label | angle := (index * 360/ data size) degreesToRadians. label := (RTRotatedLabel new text: (data at: index); height: 5) element. label translateBy: (Point r: label trachelShape notRotatedWidth/2+(diameter/2)+gap theta: angle). view add: label. angle := angle radiansToDegrees. angle := angle + ((angle between: 90 and: 270) ifTrue: [ 180 ] ifFalse: [ 0 ]). label trachelShape angleInDegree: angle. ]. view
.=.=.=.=.=.=.=.=.=.=.=.=.=.=.=.=.=.=.=.=.=.=.=.=.=.=.=.=.=.=.=.=.=.=.=.=.=.=.=.=.=.=.=.=.=.=.=.=.=.=
Cheers, Milton
2015-12-23 20:36 GMT-04:00 Offray Vladimir Luna Cárdenas offray.luna@mutabit.com: Hi,
I'm trying to understand the code behind the figure here to rotate labels:
<mime-attachment.png>
So, I made a minimal example to start with, here (code is at http://ws.stfx.eu/N6ZG4BAIBO00 )
<mime-attachment.png>
Now I would like to rotate the text to made it look like the first image. I presume that the code that made this possible for the first case is this one:
==================== RTBundleBuilder>>createLabelFor: e view: aView | lbl | lbl := label elementOn: e model. self interaction setUpElement: lbl. aView add: lbl. e addCallback: (TRTranslationCallback new block: [ | angle | angle := (e position - center ) theta. lbl translateTo: e position+((lbl trachelShape notRotatedWidth/2) * (angle cos @ angle sin)). angle := angle radiansToDegrees. angle := angle + ((angle between: 90 and: 270) ifTrue: [ 180 ] ifFalse: [ 0 ]). lbl trachelShape angleInDegree: angle ] ). e translateTo: e position. ====================
but I can not quite understand the lines
lbl translateTo: e position+((lbl trachelShape notRotatedWidth/2) * (angle cos @ angle sin)).
and
angle := angle + ((angle between: 90 and: 270) ifTrue: [ 180 ] ifFalse: [ 0 ]).
Could some body explain me how to incorporate rotation to the first basic example at http://ws.stfx.eu/N6ZG4BAIBO00 (second image of this mail).
Thanks,
Offray
Moose-dev mailing list Moose-dev@list.inf.unibe.ch https://www.list.inf.unibe.ch/listinfo/moose-dev
Moose-dev mailing list
Moose-dev@list.inf.unibe.ch https://www.list.inf.unibe.ch/listinfo/moose-dev
Moose-dev mailing list Moose-dev@list.inf.unibe.ch https://www.list.inf.unibe.ch/listinfo/moose-dev
Moose-dev mailing list
Moose-dev@list.inf.unibe.ch https://www.list.inf.unibe.ch/listinfo/moose-dev
Moose-dev mailing list Moose-dev@list.inf.unibe.ch https://www.list.inf.unibe.ch/listinfo/moose-dev
-- www.tudorgirba.com www.feenk.com
"What is more important: To be happy, or to make happy?"
Moose-dev mailing list Moose-dev@list.inf.unibe.ch https://www.list.inf.unibe.ch/listinfo/moose-dev
Thanks Tudor for your feedback. Some comments below.
On 03/01/16 01:57, Tudor Girba wrote:
Hi Offray,
Beautiful work.
I like how you used unsaturated colors. Just a couple of notes:
- I would try to use a more distinct set of colors for the rings that take more space. For example, the orange from the outmost ring is almost the same as the fourth one. For example, you have not yet used a green based color. Of course, this is if there isn’t a predefined meaning.
The colors doesn't have a predefined meaning other that distinguish different kind of information, so white is for no information, gray for non-approved one and color for knowing that I'm in a different row in the matrix (of course that's impossible to know without the companion conventions). The problem is that visualizations come in triplets, as shown at [1][2][3], and there is a lot of information to be discerned, so at some point is difficult to get enough contrast in the color palettes (one of 16 colors and other one of 25), so for the bigger one the main point was to differentiate closer rows from each other. But you're right, at least in the same visualization, if is possible to have a diverse palette, it should be used (see a more distinct palette for the previous example on [3])
[1] https://offray.withknown.com/2016/matrix-sunburst-visualization-example-for-... [2] https://offray.withknown.com/2016/matrix-sunburst-visualization-example-for-... [3] https://offray.withknown.com/2016/matrix-sunburst-visualization-example-for-...
- instead of the gray grid, I would use a plain white (or even transparent). This would still allow enough distinction with less energy. This would also create less confusion when using gray as colors for data. Right now, the two gray rings look more like something is disabled, or not applicable.
Yes, thats the case for gray, so is kind of working :-).
We still have to look at the code, but this is a significant piece of work that shows how you have come a long way in such a short amount of time. It would be great to have this as a builder in Roassal. Thank you for your contribution!
Hopefully it will be part of the Roassal galleries. I have talked with Alexandre about adding some galleries for problems approached by visualizations. This could be there and some techniques could be abstracted for similar visualizations. The code is from a self-learner rookie with (a lot of) help from the community, and I have been "chasing the platform" since Pharo 3 half a year ago to Moose 4, to pharo 4 and now to Moose 6. Being a newbie and non-developer there is a certain sense of vertigo going that fast, but the community has been awesome supporting me. In that chasing I have been able to see changes in the environment, particularly the spotter, so now I'm more aware of packages like Matrix or Tree that I didn't know they exist year and a half ago (despite looking for them).
So a lot of improvements to be done, but is nice to be learning with all of you.
Cheers,
Offray
-
 Alexandre Bergel
 -
 milton mamani
 -
 Offray Vladimir Luna Cárdenas
 -
 Tudor Girba