
Hello
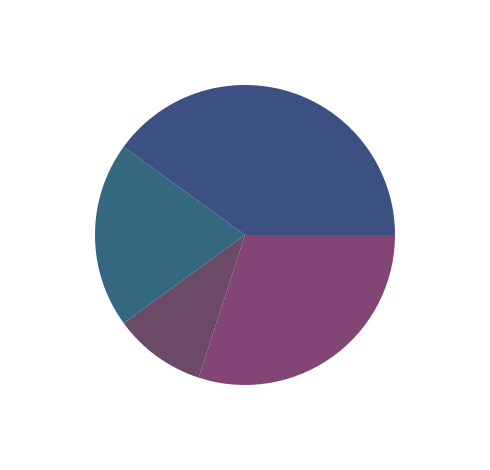
I am trying GET2 pieDiagram builder. You may want to add a random color in the #pieExample method so it looks nicer (see attachment):
| diag | diag := GET2DiagramBuilder new. (diag pieDiagram) models: #(30 10 20 40); color: [ Color random ]. ^ diag open.
Now my question is simple, but I don't know how to start
How would you add labels to each sector?
Hernán

Hi Hernán,
Thanks for your effort. This is very valuable. However, I am not sure a pie diagram should be part of GraphET. A pie is radically different from a curve. Maybe subclassing the class RTBuilder is the way to go. You will then not be constraint by GraphET for the labeling...
Cheers, Alexandre
On Jul 25, 2014, at 8:41 PM, Hernán Morales Durand hernan.morales@gmail.com wrote:
Hello
I am trying GET2 pieDiagram builder. You may want to add a random color in the #pieExample method so it looks nicer (see attachment):
| diag | diag := GET2DiagramBuilder new. (diag pieDiagram) models: #(30 10 20 40); color: [ Color random ]. ^ diag open.
Now my question is simple, but I don't know how to start
How would you add labels to each sector?
Hernán
<PieChart_1.png>_______________________________________________ Moose-dev mailing list Moose-dev@iam.unibe.ch https://www.iam.unibe.ch/mailman/listinfo/moose-dev
Thanks Alex,
I did not finished reading the chapter about RTBuilder yet. But regardless of the GraphET2 scope, having a pie diagram builder is important for Pharo (I don't know the status of PieChartMorph but I will check).
I have tried two different directions. One is adding a RTLabel to each sector shape in #getElementsFromModels
GET2PieDiagram>>getElementsFromModels
... label := RTLabel new text: model key. shape := shape + label. ...
| diag | diag := GET2DiagramBuilder new. (diag pieDiagram) function: #value; models: {'A' -> 30 . 'B' -> 10 . 'C' -> 20 . 'D' -> 40}; color: [ Color random ]. ^ diag open.
Another one is using #modelLabels: to add labels to axis:
| diag | diag := GET2DiagramBuilder new. (diag pieDiagram) modelLabels: #key; function: #value; models: {'A' -> 30 . 'B' -> 10 . 'C' -> 20 . 'D' -> 40}; color: [ Color random ]. ^ diag open.
but none of them positions the labels nicely. If anyone wants to comment would be very welcome :) Cheers,
Hernán
2014-07-26 14:14 GMT-03:00 Alexandre Bergel alexandre.bergel@me.com:
Hi Hernán,
Thanks for your effort. This is very valuable. However, I am not sure a pie diagram should be part of GraphET. A pie is radically different from a curve. Maybe subclassing the class RTBuilder is the way to go. You will then not be constraint by GraphET for the labeling...
Cheers, Alexandre
On Jul 25, 2014, at 8:41 PM, Hernán Morales Durand < hernan.morales@gmail.com> wrote:
Hello
I am trying GET2 pieDiagram builder. You may want to add a random color
in the #pieExample method so it looks nicer (see attachment):
| diag | diag := GET2DiagramBuilder new. (diag pieDiagram) models: #(30 10 20 40); color: [ Color random ]. ^ diag open.
Now my question is simple, but I don't know how to start
How would you add labels to each sector?
Hernán
<PieChart_1.png>_______________________________________________ Moose-dev mailing list Moose-dev@iam.unibe.ch https://www.iam.unibe.ch/mailman/listinfo/moose-dev
-- _,.;:~^~:;._,.;:~^~:;._,.;:~^~:;._,.;:~^~:;._,.;: Alexandre Bergel http://www.bergel.eu ^~:;._,.;:~^~:;._,.;:~^~:;._,.;:~^~:;._,.;:~^~:;.
Moose-dev mailing list Moose-dev@iam.unibe.ch https://www.iam.unibe.ch/mailman/listinfo/moose-dev
Hi Hernan,
What is the status of your Pie chart ? Is it kept separated from GraphET2?
Alexandre
On Jul 28, 2014, at 6:29 PM, Hernán Morales Durand hernan.morales@gmail.com wrote:
Thanks Alex,
I did not finished reading the chapter about RTBuilder yet. But regardless of the GraphET2 scope, having a pie diagram builder is important for Pharo (I don't know the status of PieChartMorph but I will check).
I have tried two different directions. One is adding a RTLabel to each sector shape in #getElementsFromModels
GET2PieDiagram>>getElementsFromModels
... label := RTLabel new text: model key. shape := shape + label. ...
| diag | diag := GET2DiagramBuilder new. (diag pieDiagram) function: #value; models: {'A' -> 30 . 'B' -> 10 . 'C' -> 20 . 'D' -> 40}; color: [ Color random ]. ^ diag open.
Another one is using #modelLabels: to add labels to axis:
| diag | diag := GET2DiagramBuilder new. (diag pieDiagram) modelLabels: #key; function: #value; models: {'A' -> 30 . 'B' -> 10 . 'C' -> 20 . 'D' -> 40}; color: [ Color random ]. ^ diag open.
but none of them positions the labels nicely. If anyone wants to comment would be very welcome :) Cheers,
Hernán
2014-07-26 14:14 GMT-03:00 Alexandre Bergel alexandre.bergel@me.com: Hi Hernán,
Thanks for your effort. This is very valuable. However, I am not sure a pie diagram should be part of GraphET. A pie is radically different from a curve. Maybe subclassing the class RTBuilder is the way to go. You will then not be constraint by GraphET for the labeling...
Cheers, Alexandre
On Jul 25, 2014, at 8:41 PM, Hernán Morales Durand hernan.morales@gmail.com wrote:
Hello
I am trying GET2 pieDiagram builder. You may want to add a random color in the #pieExample method so it looks nicer (see attachment):
| diag | diag := GET2DiagramBuilder new. (diag pieDiagram) models: #(30 10 20 40); color: [ Color random ]. ^ diag open.
Now my question is simple, but I don't know how to start
How would you add labels to each sector?
Hernán
<PieChart_1.png>_______________________________________________ Moose-dev mailing list Moose-dev@iam.unibe.ch https://www.iam.unibe.ch/mailman/listinfo/moose-dev
-- _,.;:~^~:;._,.;:~^~:;._,.;:~^~:;._,.;:~^~:;._,.;: Alexandre Bergel http://www.bergel.eu ^~:;._,.;:~^~:;._,.;:~^~:;._,.;:~^~:;._,.;:~^~:;.
Moose-dev mailing list Moose-dev@iam.unibe.ch https://www.iam.unibe.ch/mailman/listinfo/moose-dev
Moose-dev mailing list Moose-dev@iam.unibe.ch https://www.iam.unibe.ch/mailman/listinfo/moose-dev
Hi Alex,
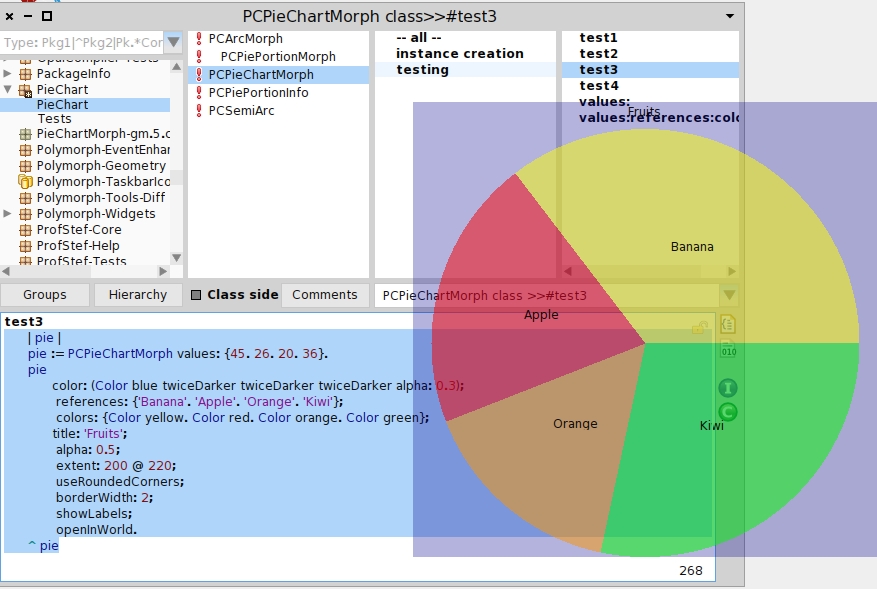
Maybe I was not clear enough, I didn't meant to say I will write a Pie chart :) I have just tried to add labels to GraphET2 but finally I have ported the PieChartMorph to Pharo 3 and looks good (see attachment) even almost all tests passed: 49 run, 48 passes, 0 skipped, 0 expected failures, 0 failures, 1 errors, 0 unexpected passes.
PieChartMorph is completely independent of GraphET2, here is status info and credits: http://wiki.squeak.org/squeak/2624
Hernán
2014-07-31 20:09 GMT-03:00 Alexandre Bergel alexandre.bergel@me.com:
Hi Hernan,
What is the status of your Pie chart ? Is it kept separated from GraphET2?
Alexandre
On Jul 28, 2014, at 6:29 PM, Hernán Morales Durand < hernan.morales@gmail.com> wrote:
Thanks Alex,
I did not finished reading the chapter about RTBuilder yet. But
regardless of the GraphET2 scope, having a pie diagram builder is important for Pharo (I don't know the status of PieChartMorph but I will check).
I have tried two different directions. One is adding a RTLabel to each
sector shape in #getElementsFromModels
GET2PieDiagram>>getElementsFromModels
... label := RTLabel new text: model key. shape := shape + label. ...
| diag | diag := GET2DiagramBuilder new. (diag pieDiagram) function: #value; models: {'A' -> 30 . 'B' -> 10 . 'C' -> 20 . 'D' -> 40}; color: [ Color random ]. ^ diag open.
Another one is using #modelLabels: to add labels to axis:
| diag | diag := GET2DiagramBuilder new. (diag pieDiagram) modelLabels: #key; function: #value; models: {'A' -> 30 . 'B' -> 10 . 'C' -> 20 . 'D' -> 40}; color: [ Color random ]. ^ diag open.
but none of them positions the labels nicely. If anyone wants to comment
would be very welcome :)
Cheers,
Hernán
2014-07-26 14:14 GMT-03:00 Alexandre Bergel alexandre.bergel@me.com: Hi Hernán,
Thanks for your effort. This is very valuable. However, I am not sure a pie diagram should be part of GraphET. A pie is
radically different from a curve. Maybe subclassing the class RTBuilder is the way to go. You will then not be constraint by GraphET for the labeling...
Cheers, Alexandre
On Jul 25, 2014, at 8:41 PM, Hernán Morales Durand <
hernan.morales@gmail.com> wrote:
Hello
I am trying GET2 pieDiagram builder. You may want to add a random
color in the #pieExample method so it looks nicer (see attachment):
| diag | diag := GET2DiagramBuilder new. (diag pieDiagram) models: #(30 10 20 40); color: [ Color random ]. ^ diag open.
Now my question is simple, but I don't know how to start
How would you add labels to each sector?
Hernán
<PieChart_1.png>_______________________________________________ Moose-dev mailing list Moose-dev@iam.unibe.ch https://www.iam.unibe.ch/mailman/listinfo/moose-dev
-- _,.;:~^~:;._,.;:~^~:;._,.;:~^~:;._,.;:~^~:;._,.;: Alexandre Bergel http://www.bergel.eu ^~:;._,.;:~^~:;._,.;:~^~:;._,.;:~^~:;._,.;:~^~:;.
Moose-dev mailing list Moose-dev@iam.unibe.ch https://www.iam.unibe.ch/mailman/listinfo/moose-dev
Moose-dev mailing list Moose-dev@iam.unibe.ch https://www.iam.unibe.ch/mailman/listinfo/moose-dev
-- _,.;:~^~:;._,.;:~^~:;._,.;:~^~:;._,.;:~^~:;._,.;: Alexandre Bergel http://www.bergel.eu ^~:;._,.;:~^~:;._,.;:~^~:;._,.;:~^~:;._,.;:~^~:;.
Moose-dev mailing list Moose-dev@iam.unibe.ch https://www.iam.unibe.ch/mailman/listinfo/moose-dev
Hi Hernán,
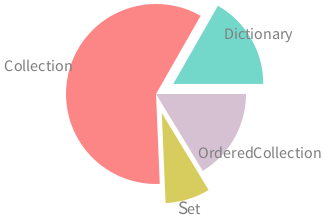
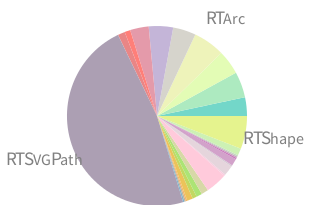
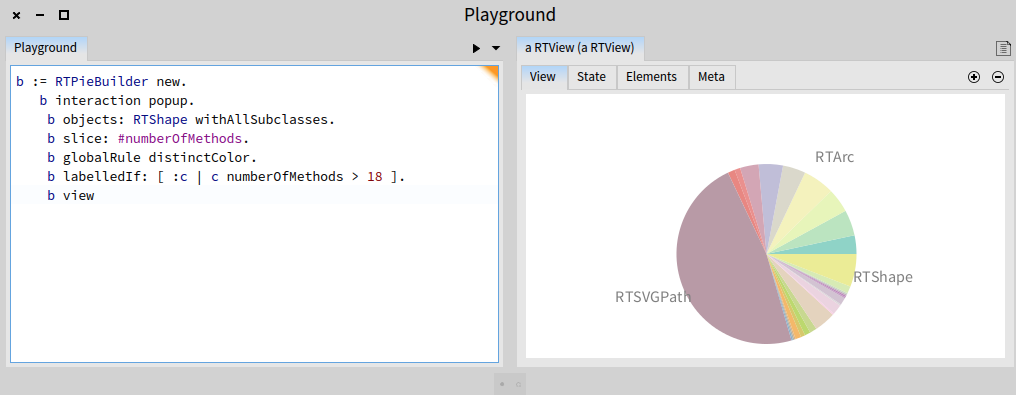
I did a bit of programming today and did a PieBuilder. Here are some example: -=-=-=-=-=-=-=-=-= b := RTPieBuilder new. b interaction popup. b objects: RTShape withAllSubclasses. b slice: #numberOfMethods. b globalRule distinctColor. b labelledIf: [ :c | c numberOfMethods > 18 ]. b view -=-=-=-=-=-=-=-=-=
-=-=-=-=-=-=-=-=-= | b | b := RTPieBuilder new. b interaction popup. b objects: (Array with: Dictionary with: Collection with: Set with: OrderedCollection ). b slice: #numberOfMethods. b globalRule distinctColor. b labelled. b emphasize: Set by: 20. b emphasize: Dictionary by: 20. b open. -=-=-=-=-=-=-=-=-=
Some example have been added to the Roassal example browser, available from the World menu.
This is just a beginning. I made these example without a clear scenario in mind. If you come with a specific need, probably you will be able to adjust the PieBuilder. For example, you may want to particularize the position of the labeling
Cheers, Alexandre
On Jul 28, 2014, at 6:29 PM, Hernán Morales Durand hernan.morales@gmail.com wrote:
Thanks Alex,
I did not finished reading the chapter about RTBuilder yet. But regardless of the GraphET2 scope, having a pie diagram builder is important for Pharo (I don't know the status of PieChartMorph but I will check).
I have tried two different directions. One is adding a RTLabel to each sector shape in #getElementsFromModels
GET2PieDiagram>>getElementsFromModels
... label := RTLabel new text: model key. shape := shape + label. ...
| diag | diag := GET2DiagramBuilder new. (diag pieDiagram) function: #value; models: {'A' -> 30 . 'B' -> 10 . 'C' -> 20 . 'D' -> 40}; color: [ Color random ]. ^ diag open.
Another one is using #modelLabels: to add labels to axis:
| diag | diag := GET2DiagramBuilder new. (diag pieDiagram) modelLabels: #key; function: #value; models: {'A' -> 30 . 'B' -> 10 . 'C' -> 20 . 'D' -> 40}; color: [ Color random ]. ^ diag open.
but none of them positions the labels nicely. If anyone wants to comment would be very welcome :) Cheers,
Hernán
2014-07-26 14:14 GMT-03:00 Alexandre Bergel alexandre.bergel@me.com: Hi Hernán,
Thanks for your effort. This is very valuable. However, I am not sure a pie diagram should be part of GraphET. A pie is radically different from a curve. Maybe subclassing the class RTBuilder is the way to go. You will then not be constraint by GraphET for the labeling...
Cheers, Alexandre
On Jul 25, 2014, at 8:41 PM, Hernán Morales Durand hernan.morales@gmail.com wrote:
Hello
I am trying GET2 pieDiagram builder. You may want to add a random color in the #pieExample method so it looks nicer (see attachment):
| diag | diag := GET2DiagramBuilder new. (diag pieDiagram) models: #(30 10 20 40); color: [ Color random ]. ^ diag open.
Now my question is simple, but I don't know how to start
How would you add labels to each sector?
Hernán
<PieChart_1.png>_______________________________________________ Moose-dev mailing list Moose-dev@iam.unibe.ch https://www.iam.unibe.ch/mailman/listinfo/moose-dev
-- _,.;:~^~:;._,.;:~^~:;._,.;:~^~:;._,.;:~^~:;._,.;: Alexandre Bergel http://www.bergel.eu ^~:;._,.;:~^~:;._,.;:~^~:;._,.;:~^~:;._,.;:~^~:;.
Moose-dev mailing list Moose-dev@iam.unibe.ch https://www.iam.unibe.ch/mailman/listinfo/moose-dev
Moose-dev mailing list Moose-dev@iam.unibe.ch https://www.iam.unibe.ch/mailman/listinfo/moose-dev

Thank you Alex for Pie chart support in Charter.
On Sun, Aug 3, 2014 at 3:10 AM, Alexandre Bergel alexandre.bergel@me.com wrote:
Hi Hernán,
I did a bit of programming today and did a PieBuilder. Here are some example: -=-=-=-=-=-=-=-=-= b := RTPieBuilder new. b interaction popup. b objects: RTShape withAllSubclasses. b slice: #numberOfMethods. b globalRule distinctColor. b labelledIf: [ :c | c numberOfMethods > 18 ]. b view -=-=-=-=-=-=-=-=-=
-=-=-=-=-=-=-=-=-= | b | b := RTPieBuilder new. b interaction popup. b objects: (Array with: Dictionary with: Collection with: Set with: OrderedCollection ). b slice: #numberOfMethods. b globalRule distinctColor. b labelled. b emphasize: Set by: 20. b emphasize: Dictionary by: 20. b open. -=-=-=-=-=-=-=-=-=
Some example have been added to the Roassal example browser, available from the World menu.
This is just a beginning. I made these example without a clear scenario in mind. If you come with a specific need, probably you will be able to adjust the PieBuilder. For example, you may want to particularize the position of the labeling
Cheers, Alexandre
On Jul 28, 2014, at 6:29 PM, Hernán Morales Durand < hernan.morales@gmail.com> wrote:
Thanks Alex,
I did not finished reading the chapter about RTBuilder yet. But regardless of the GraphET2 scope, having a pie diagram builder is important for Pharo (I don't know the status of PieChartMorph but I will check).
I have tried two different directions. One is adding a RTLabel to each sector shape in #getElementsFromModels
GET2PieDiagram>>getElementsFromModels
... label := RTLabel new text: model key. shape := shape + label. ...
| diag | diag := GET2DiagramBuilder new. (diag pieDiagram) function: #value; models: {'A' -> 30 . 'B' -> 10 . 'C' -> 20 . 'D' -> 40}; color: [ Color random ]. ^ diag open.
Another one is using #modelLabels: to add labels to axis:
| diag | diag := GET2DiagramBuilder new. (diag pieDiagram) modelLabels: #key; function: #value; models: {'A' -> 30 . 'B' -> 10 . 'C' -> 20 . 'D' -> 40}; color: [ Color random ]. ^ diag open.
but none of them positions the labels nicely. If anyone wants to comment would be very welcome :) Cheers,
Hernán
2014-07-26 14:14 GMT-03:00 Alexandre Bergel alexandre.bergel@me.com: Hi Hernán,
Thanks for your effort. This is very valuable. However, I am not sure a pie diagram should be part of GraphET. A pie is radically different from a curve. Maybe subclassing the class RTBuilder is the way to go. You will then not be constraint by GraphET for the labeling...
Cheers, Alexandre
On Jul 25, 2014, at 8:41 PM, Hernán Morales Durand < hernan.morales@gmail.com> wrote:
Hello
I am trying GET2 pieDiagram builder. You may want to add a random color
in the #pieExample method so it looks nicer (see attachment):
| diag | diag := GET2DiagramBuilder new. (diag pieDiagram) models: #(30 10 20 40); color: [ Color random ]. ^ diag open.
Now my question is simple, but I don't know how to start
How would you add labels to each sector?
Hernán
<PieChart_1.png>_______________________________________________ Moose-dev mailing list Moose-dev@iam.unibe.ch https://www.iam.unibe.ch/mailman/listinfo/moose-dev
-- _,.;:~^~:;._,.;:~^~:;._,.;:~^~:;._,.;:~^~:;._,.;: Alexandre Bergel http://www.bergel.eu ^~:;._,.;:~^~:;._,.;:~^~:;._,.;:~^~:;._,.;:~^~:;.
Moose-dev mailing list Moose-dev@iam.unibe.ch https://www.iam.unibe.ch/mailman/listinfo/moose-dev
Moose-dev mailing list Moose-dev@iam.unibe.ch https://www.iam.unibe.ch/mailman/listinfo/moose-dev
-- _,.;:~^~:;._,.;:~^~:;._,.;:~^~:;._,.;:~^~:;._,.;: Alexandre Bergel http://www.bergel.eu ^~:;._,.;:~^~:;._,.;:~^~:;._,.;:~^~:;._,.;:~^~:;.
Moose-dev mailing list Moose-dev@iam.unibe.ch https://www.iam.unibe.ch/mailman/listinfo/moose-dev

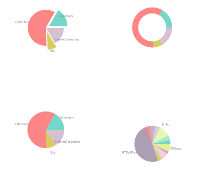
Hi,
I have the Moose 5.0 beta and the code using RTPieBuilder is not working properly showed below. There is any way to update Roassal to support this?
Cheers,
Offray
On 08/04/2014 03:07 AM, Usman Bhatti wrote:
Thank you Alex for Pie chart support in Charter.
On Sun, Aug 3, 2014 at 3:10 AM, Alexandre Bergel <alexandre.bergel@me.com mailto:alexandre.bergel@me.com> wrote:
Hi Hernán, I did a bit of programming today and did a PieBuilder. Here are some example: -=-=-=-=-=-=-=-=-= b := RTPieBuilder new. b interaction popup. b objects: RTShape withAllSubclasses. b slice: #numberOfMethods. b globalRule distinctColor. b labelledIf: [ :c | c numberOfMethods > 18 ]. b view -=-=-=-=-=-=-=-=-= -=-=-=-=-=-=-=-=-= | b | b := RTPieBuilder new. b interaction popup. b objects: (Array with: Dictionary with: Collection with: Set with: OrderedCollection ). b slice: #numberOfMethods. b globalRule distinctColor. b labelled. b emphasize: Set by: 20. b emphasize: Dictionary by: 20. b open. -=-=-=-=-=-=-=-=-= Some example have been added to the Roassal example browser, available from the World menu. This is just a beginning. I made these example without a clear scenario in mind. If you come with a specific need, probably you will be able to adjust the PieBuilder. For example, you may want to particularize the position of the labeling Cheers, Alexandre On Jul 28, 2014, at 6:29 PM, Hernán Morales Durand <hernan.morales@gmail.com <mailto:hernan.morales@gmail.com>> wrote:Thanks Alex, I did not finished reading the chapter about RTBuilder yet. But regardless of the GraphET2 scope, having a pie diagram builder is important for Pharo (I don't know the status of PieChartMorph but I will check). I have tried two different directions. One is adding a RTLabel to each sector shape in #getElementsFromModels GET2PieDiagram>>getElementsFromModels ... label := RTLabel new text: model key. shape := shape + label. ... | diag | diag := GET2DiagramBuilder new. (diag pieDiagram) function: #value; models: {'A' -> 30 . 'B' -> 10 . 'C' -> 20 . 'D' -> 40}; color: [ Color random ]. ^ diag open. Another one is using #modelLabels: to add labels to axis: | diag | diag := GET2DiagramBuilder new. (diag pieDiagram) modelLabels: #key; function: #value; models: {'A' -> 30 . 'B' -> 10 . 'C' -> 20 . 'D' -> 40}; color: [ Color random ]. ^ diag open. but none of them positions the labels nicely. If anyone wants to comment would be very welcome :) Cheers, Hernán 2014-07-26 14:14 GMT-03:00 Alexandre Bergel <alexandre.bergel@me.com <mailto:alexandre.bergel@me.com>>: Hi Hernán, Thanks for your effort. This is very valuable. However, I am not sure a pie diagram should be part of GraphET. A pie is radically different from a curve. Maybe subclassing the class RTBuilder is the way to go. You will then not be constraint by GraphET for the labeling... Cheers, Alexandre On Jul 25, 2014, at 8:41 PM, Hernán Morales Durand <hernan.morales@gmail.com <mailto:hernan.morales@gmail.com>> wrote: > Hello > > I am trying GET2 pieDiagram builder. You may want to add a random color in the #pieExample method so it looks nicer (see attachment): > > | diag | > diag := GET2DiagramBuilder new. > (diag pieDiagram) > models: #(30 10 20 40); > color: [ Color random ]. > ^ diag open. > > Now my question is simple, but I don't know how to start > > How would you add labels to each sector? > > Hernán > > > <PieChart_1.png>_______________________________________________ > Moose-dev mailing list > Moose-dev@iam.unibe.ch <mailto:Moose-dev@iam.unibe.ch> > https://www.iam.unibe.ch/mailman/listinfo/moose-dev -- _,.;:~^~:;._,.;:~^~:;._,.;:~^~:;._,.;:~^~:;._,.;: Alexandre Bergel http://www.bergel.eu ^~:;._,.;:~^~:;._,.;:~^~:;._,.;:~^~:;._,.;:~^~:;. _______________________________________________ Moose-dev mailing list Moose-dev@iam.unibe.ch <mailto:Moose-dev@iam.unibe.ch> https://www.iam.unibe.ch/mailman/listinfo/moose-dev _______________________________________________ Moose-dev mailing list Moose-dev@iam.unibe.ch <mailto:Moose-dev@iam.unibe.ch> https://www.iam.unibe.ch/mailman/listinfo/moose-dev-- _,.;:~^~:;._,.;:~^~:;._,.;:~^~:;._,.;:~^~:;._,.;: Alexandre Bergel http://www.bergel.eu ^~:;._,.;:~^~:;._,.;:~^~:;._,.;:~^~:;._,.;:~^~:;. _______________________________________________ Moose-dev mailing list Moose-dev@iam.unibe.ch <mailto:Moose-dev@iam.unibe.ch> https://www.iam.unibe.ch/mailman/listinfo/moose-dev
Moose-dev mailing list Moose-dev@iam.unibe.ch https://www.iam.unibe.ch/mailman/listinfo/moose-dev
Hi Offray,
I have tried from a different image, and it works for me. I opened a playground, and entered -=-=-=-=-=-=-=-=-=-=-=-= b := RTPieBuilder new. b interaction popup. b objects: RTShape withAllSubclasses. b slice: #numberOfMethods. b globalRule distinctColor. b labelledIf: [ :c | c numberOfMethods > 18 ]. b view -=-=-=-=-=-=-=-=-=-=-=-=
I select all and pressed Cmd-o
What do you obtain? Have you updated Roassal2?
Cheers, Alexandre
I really like it, thanks Alex for such nice work!
As you guessed, I have some need of a separated column for labels, as shown here : http://en.wikipedia.org/wiki/Pie_chart#mediaviewer/File:Pie_chart_EP_electio...
Instead of doing #objects, and then #slice: , I have a collection of collections and then added a simple method based on #slice:
RTPieBuilder>>groupedObjects: groupedCollection | es | objects := groupedCollection. values := groupedCollection collect: #size. sum := values sum. es := self elementsOn: groupedCollection. view addAll: es. ^ es
then each subcollection can re-implement #asString for displaying label from a representative or a sum, etc.
By the way how did you get the transparency effect?
Cheers,
Hernán
2014-08-02 22:10 GMT-03:00 Alexandre Bergel alexandre.bergel@me.com:
Hi Hernán,
I did a bit of programming today and did a PieBuilder. Here are some example: -=-=-=-=-=-=-=-=-= b := RTPieBuilder new. b interaction popup. b objects: RTShape withAllSubclasses. b slice: #numberOfMethods. b globalRule distinctColor. b labelledIf: [ :c | c numberOfMethods > 18 ]. b view -=-=-=-=-=-=-=-=-=
-=-=-=-=-=-=-=-=-= | b | b := RTPieBuilder new. b interaction popup. b objects: (Array with: Dictionary with: Collection with: Set with: OrderedCollection ). b slice: #numberOfMethods. b globalRule distinctColor. b labelled. b emphasize: Set by: 20. b emphasize: Dictionary by: 20. b open. -=-=-=-=-=-=-=-=-=
Some example have been added to the Roassal example browser, available from the World menu.
This is just a beginning. I made these example without a clear scenario in mind. If you come with a specific need, probably you will be able to adjust the PieBuilder. For example, you may want to particularize the position of the labeling
Cheers, Alexandre
On Jul 28, 2014, at 6:29 PM, Hernán Morales Durand < hernan.morales@gmail.com> wrote:
Thanks Alex,
I did not finished reading the chapter about RTBuilder yet. But regardless of the GraphET2 scope, having a pie diagram builder is important for Pharo (I don't know the status of PieChartMorph but I will check).
I have tried two different directions. One is adding a RTLabel to each sector shape in #getElementsFromModels
GET2PieDiagram>>getElementsFromModels
... label := RTLabel new text: model key. shape := shape + label. ...
| diag | diag := GET2DiagramBuilder new. (diag pieDiagram) function: #value; models: {'A' -> 30 . 'B' -> 10 . 'C' -> 20 . 'D' -> 40}; color: [ Color random ]. ^ diag open.
Another one is using #modelLabels: to add labels to axis:
| diag | diag := GET2DiagramBuilder new. (diag pieDiagram) modelLabels: #key; function: #value; models: {'A' -> 30 . 'B' -> 10 . 'C' -> 20 . 'D' -> 40}; color: [ Color random ]. ^ diag open.
but none of them positions the labels nicely. If anyone wants to comment would be very welcome :) Cheers,
Hernán
2014-07-26 14:14 GMT-03:00 Alexandre Bergel alexandre.bergel@me.com: Hi Hernán,
Thanks for your effort. This is very valuable. However, I am not sure a pie diagram should be part of GraphET. A pie is radically different from a curve. Maybe subclassing the class RTBuilder is the way to go. You will then not be constraint by GraphET for the labeling...
Cheers, Alexandre
On Jul 25, 2014, at 8:41 PM, Hernán Morales Durand < hernan.morales@gmail.com> wrote:
Hello
I am trying GET2 pieDiagram builder. You may want to add a random color
in the #pieExample method so it looks nicer (see attachment):
| diag | diag := GET2DiagramBuilder new. (diag pieDiagram) models: #(30 10 20 40); color: [ Color random ]. ^ diag open.
Now my question is simple, but I don't know how to start
How would you add labels to each sector?
Hernán
<PieChart_1.png>_______________________________________________ Moose-dev mailing list Moose-dev@iam.unibe.ch https://www.iam.unibe.ch/mailman/listinfo/moose-dev
-- _,.;:~^~:;._,.;:~^~:;._,.;:~^~:;._,.;:~^~:;._,.;: Alexandre Bergel http://www.bergel.eu ^~:;._,.;:~^~:;._,.;:~^~:;._,.;:~^~:;._,.;:~^~:;.
Moose-dev mailing list Moose-dev@iam.unibe.ch https://www.iam.unibe.ch/mailman/listinfo/moose-dev
Moose-dev mailing list Moose-dev@iam.unibe.ch https://www.iam.unibe.ch/mailman/listinfo/moose-dev
-- _,.;:~^~:;._,.;:~^~:;._,.;:~^~:;._,.;:~^~:;._,.;: Alexandre Bergel http://www.bergel.eu ^~:;._,.;:~^~:;._,.;:~^~:;._,.;:~^~:;._,.;:~^~:;.
Moose-dev mailing list Moose-dev@iam.unibe.ch https://www.iam.unibe.ch/mailman/listinfo/moose-dev
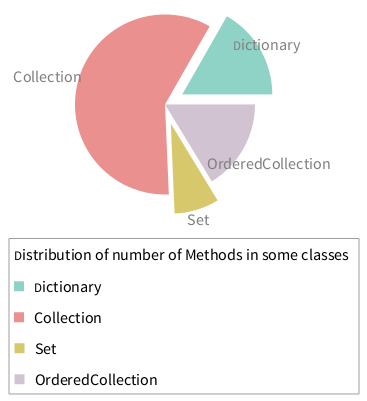
Hi Hernán,
You can use the RTLegend2Builder for this. Check this example: -=-=-=-=-=-=-=-=-=-=-=-=-=-=-= | b | myClasses := (Array with: Dictionary with: Collection with: Set with: OrderedCollection ).
b := RTPieBuilder new. b interaction popup. b objects: myClasses. b slice: #numberOfMethods. b globalRule distinctColor. b labelled. b emphasize: Set by: 20. b emphasize: Dictionary by: 20.
"Legend" lb := RTLegend2Builder new. lb view: b view. lb addText: 'Distribution of number of Methods in some classes'. normalizer := RTMultiLinearColorForIdentity new objects: myClasses. myClasses do: [ :aClass | lb addColor: (normalizer rtValue: aClass) text: aClass name. ]. lb build.
b open. -=-=-=-=-=-=-=-=-=-=-=-=-=-=-=
Maybe the class RTPieBuilder can be extended to includes a legend. (There is a bug with the encapsulating bounds of pie)
Cheers, Alexandre
-
 Alexandre Bergel
 -
 Hernán Morales Durand
 -
 Offray Vladimir Luna Cárdenas
 -
 Usman Bhatti