
Hi,
Here is an example that shows the distinction between edge and line:
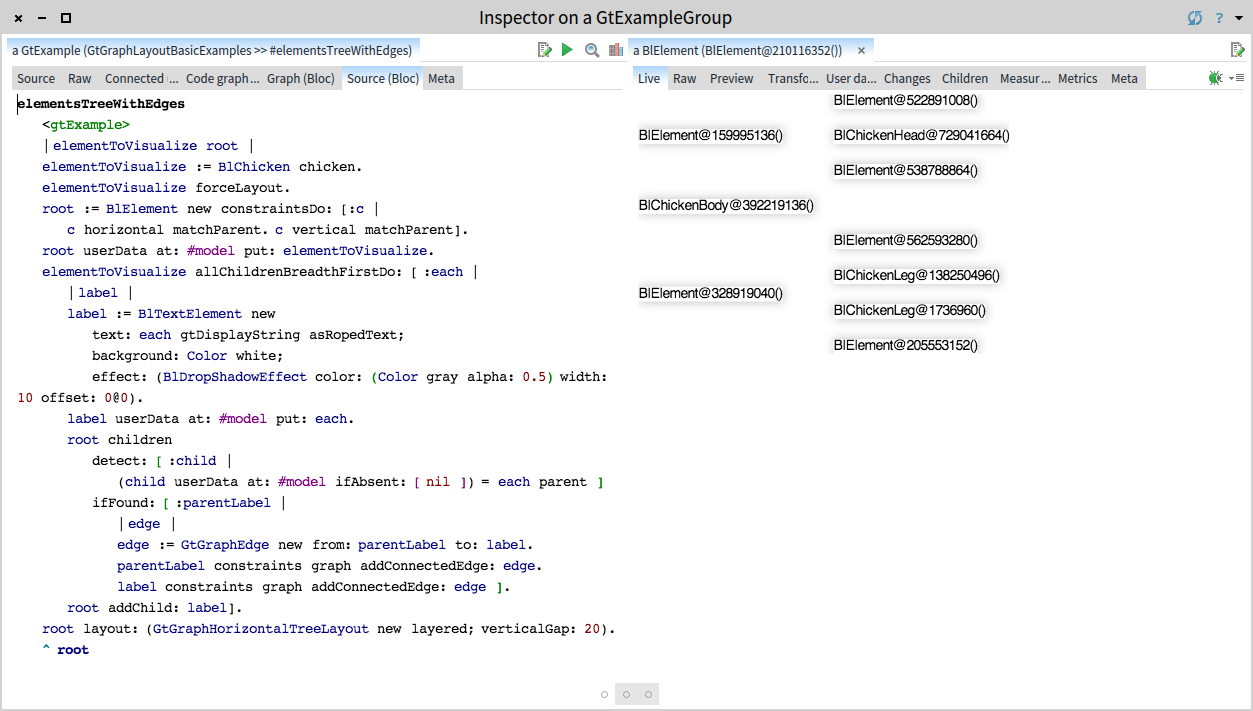
elementToVisualize := BlChicken chicken. elementToVisualize forceLayout. root := BlElement new constraintsDo: [:c | c horizontal matchParent. c vertical matchParent]. elementToVisualize allChildrenBreadthFirstDo: [ :each | | label | label := BlTextElement new text: each gtDisplayString asRopedText; background: Color white; effect: (BlDropShadowEffect color: (Color gray alpha: 0.5) width: 10 offset: 0@0). label userData at: #model put: each. root children detect: [ :child | (child userData at: #model ifAbsent: [ nil ]) = each parent ] ifFound: [ :parentLabel | | edge | edge := GtGraphEdge new from: parentLabel to: label. parentLabel constraints graph addConnectedEdge: edge. label constraints graph addConnectedEdge: edge ]. root addChild: label]. root layout: (GtGraphHorizontalTreeLayout new layered; verticalGap: 20). root
With this we visualize the elements that make the chicken element demo: - we create a label for each element - we find the parentLabel corresponding to the parent element - we create an edge between the parentLabel and the current label
The example gives us this:
The edge is a constraint. It has no visual impact. And the graph layouts take the edge constraints into account. The cool thing is the GtGraphEdge is defined next to the graph layout classes, not in the core of Bloc.
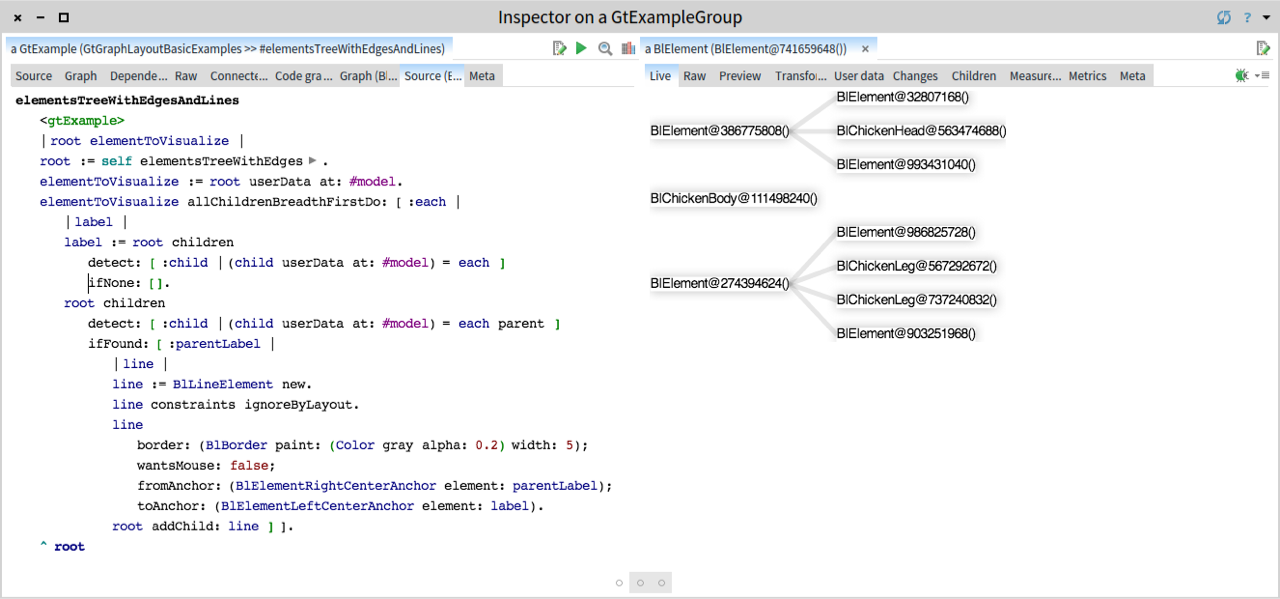
To add a visual impact, we have to create a separate line:
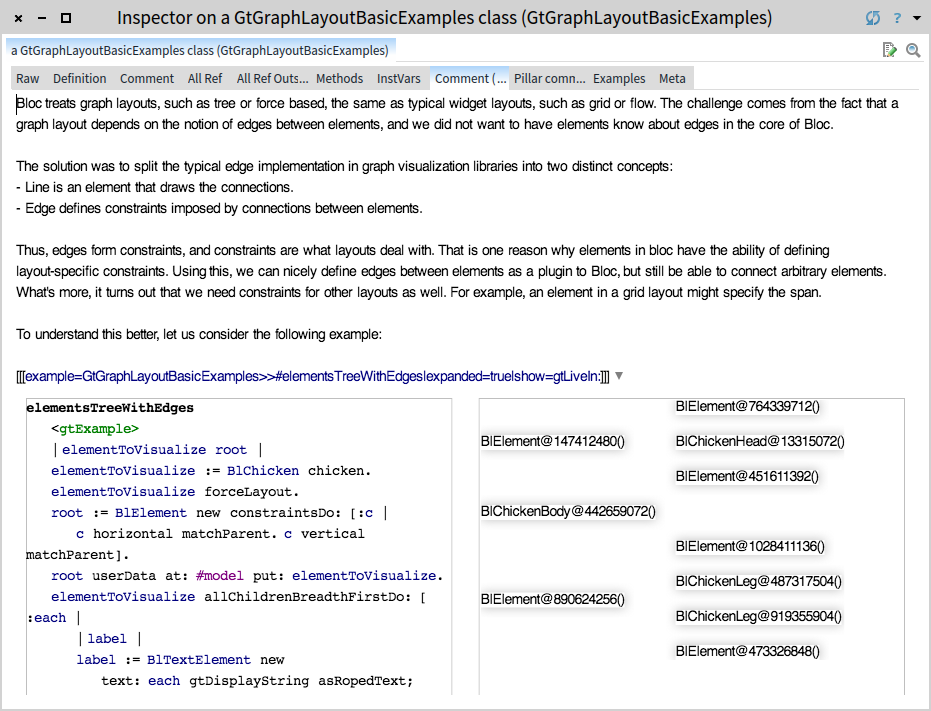
Thanks for the question. This email is now a comment in the graph layout examples and can be viewed like this:
Cheers, Doru
On Dec 9, 2017, at 8:43 AM, Stéphane Ducasse stephane.ducasse@inria.fr wrote:
Super super cool.
On 9 Dec 2017, at 08:14, Tudor Girba tudor@tudorgirba.com wrote:
Hi,
We are happy to announce GT Mondrian, a graph visualization engine built on top of Bloc.
It is similar to the original Mondrian and the Mondrian from Roassal, but it is different in that it is built directly out of Bloc elements. This is interesting because it allows us to combine typical widgets with visualizations. The other interesting thing about it is that it validates the design of Bloc: right now, the implementation has 509 lines of code (excluding graph-specific layouts). The goal is to make visualization a first class citizen and an integral part of the IDE.
The key ingredient that made this happen is that Bloc can now treat graph layouts, such as tree or force based, behave under the same rules as typical widget layouts, such as grid or flow. The challenge comes from the fact that a graph layout depends on the notion of edges between elements, and we did not want to have elements know about edges in the core of Bloc.
The solution was to split the typical edge implementation in graph visualization libraries into two distinct concepts: • Line is an element that draws the connections. • Edge defines constraints imposed by connections between elements.
Can you give an example?
BTW doru did you think about having a bloc layer on top of telescope model? Because from that perspective telescope offers a visualisation model while roassal/mondrian like design are more a pen-oriented metaphor.
I wanted to do it to learn Bloc but I’m running against time and trying to flush pilling duties (I want to also release the book that we wrote with luc and olivier and convert the seaside book and and and….. :(
Thus, edges form constraints, and constraints are what layouts deal with. That is one reason why elements in bloc have the ability of defining layout-specific constraints. Using this, we can nicely define edges between elements as a plugin to Bloc, but still be able to connect arbitrary elements. What's more, it turns out that we need constraints for other layouts as well. For example, an element in a grid layout might specify the span.
The API of GT Mondrian is similar to the one from Roassal, but there are a few differences as well. These are described in the Pillar documentation available in the GitHub repo.
The best way to experience GT Mondrian and its documentation is to load the GToolkit as described here: https://github.com/feenkcom/gtoolkit
If you download the GT code through Iceberg, the documentation can be experienced live by inspecting: './pharo-local/iceberg/feenkcom/gtoolkit-visualizer/doc/mondrian/index.pillar' asFileReference
<mondrian-doc.png>
Cheers, The feenk team
-- www.tudorgirba.com www.feenk.com
"Quality cannot be an afterthought."
Moose-dev mailing list Moose-dev@list.inf.unibe.ch https://www.list.inf.unibe.ch/listinfo/moose-dev
Stéphane Ducasse http://stephane.ducasse.free.fr http://www.synectique.eu / http://www.pharo.org 03 59 35 87 52 Assistant: Julie Jonas FAX 03 59 57 78 50 TEL 03 59 35 86 16 S. Ducasse - Inria 40, avenue Halley, Parc Scientifique de la Haute Borne, Bât.A, Park Plaza Villeneuve d'Ascq 59650 France
Moose-dev mailing list Moose-dev@list.inf.unibe.ch https://www.list.inf.unibe.ch/listinfo/moose-dev
-- www.tudorgirba.com www.feenk.com
"Every successful trip needs a suitable vehicle."