
Hi, I face a bug in the labelling of x-axis with GET2Line in graphET2. For example, with this code:
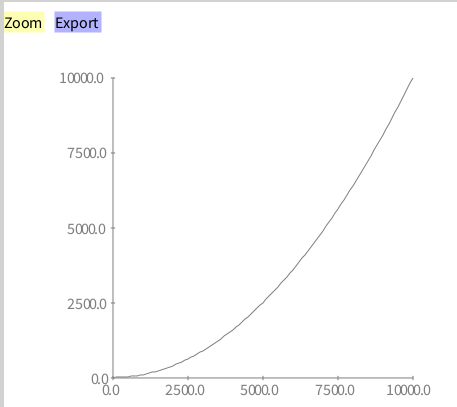
| builder | builder := GET2Line data: (0 to: 100). builder y: [ :x | x*x ]; dotSize: 10. builder open
I got the first screenshot.
With another example, i note that, the X-Axis take the right value, but the label is not correct.
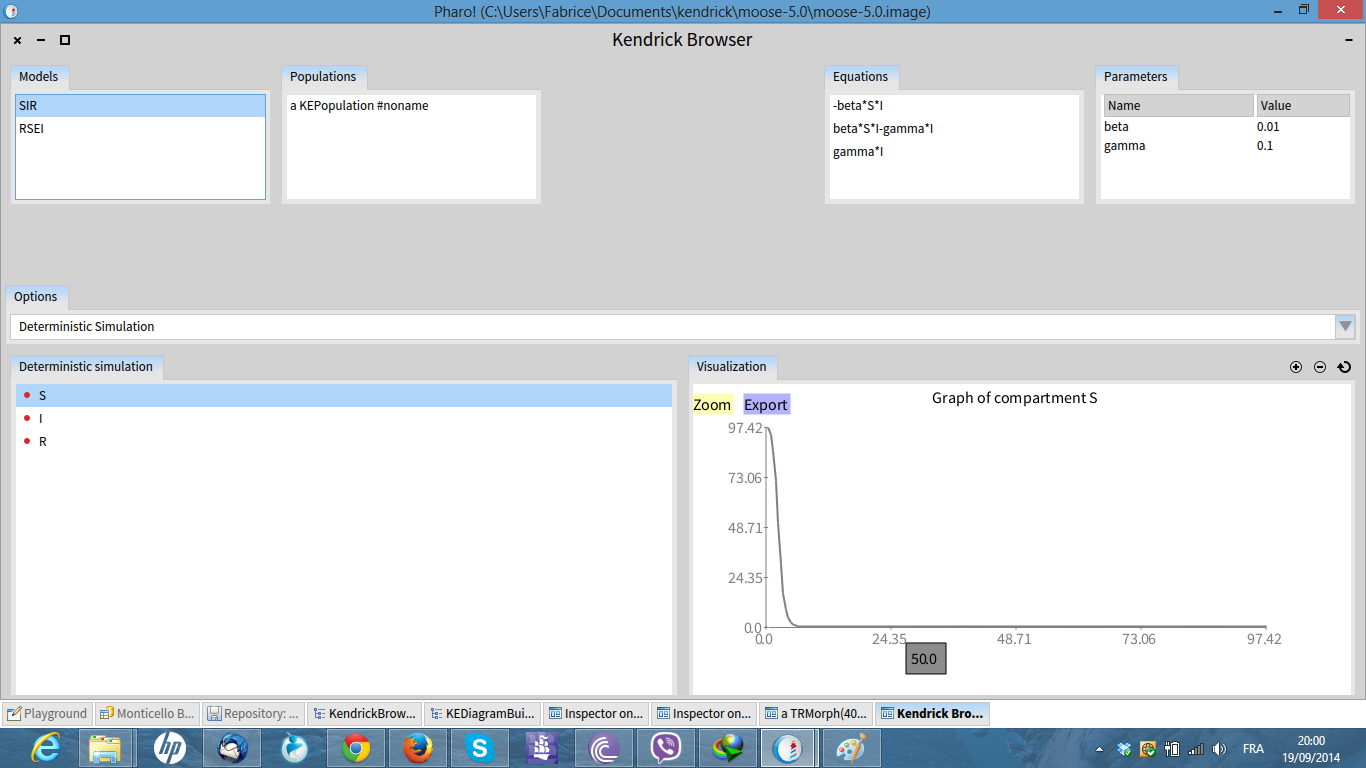
| bg| data class== KETimeSeries ifTrue:[ bg := GET2Line new view: each; data: (data index). bg x: [:e | (data index) at: e]; y: [ :x | data at: x]; title:'Graph of compartment ' ,(donne keyAtValue: data); lineWidth: 2; height: 200; width: 500. bg interaction popupText. bg build.
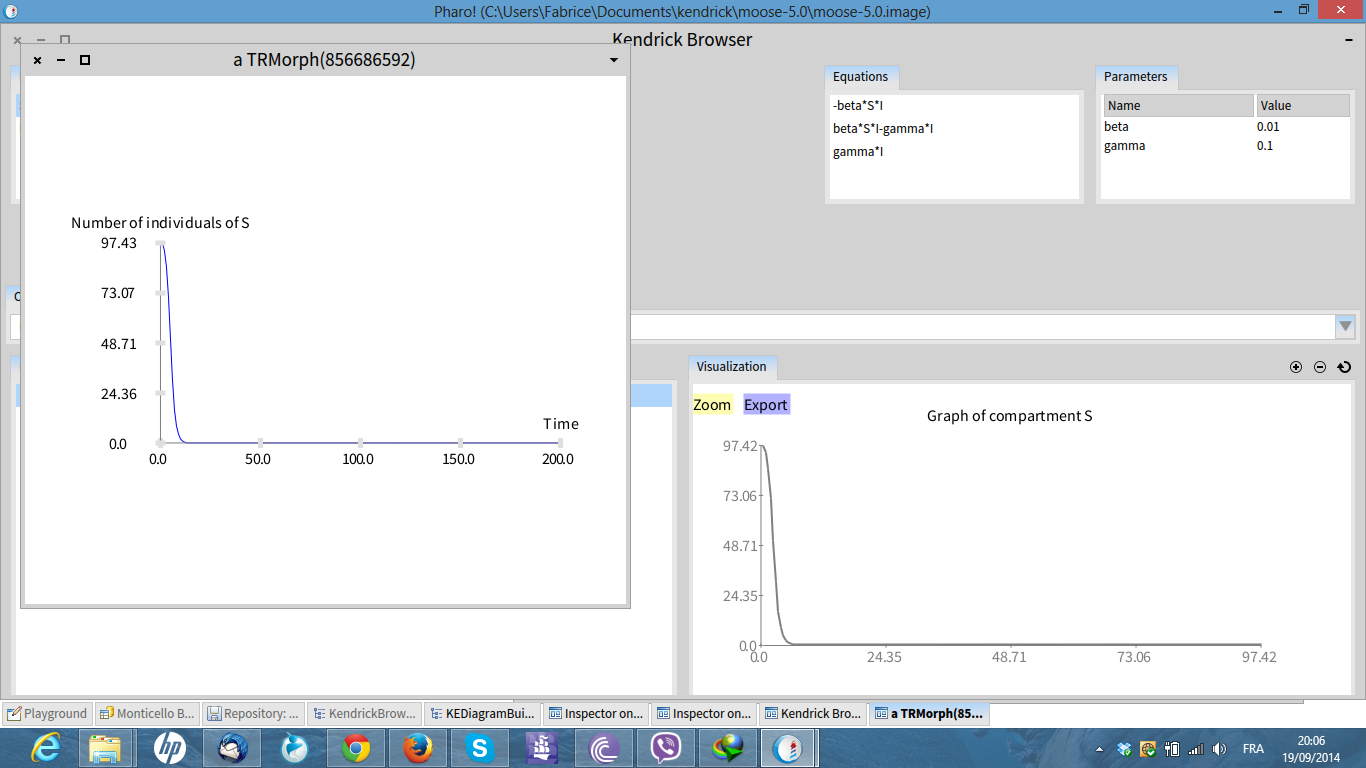
The second screenshot show that, when i point the value "24.35" on the x-axis, i get "50" because i use "interaction popupText". The third screenshot show what i got with another builder.
Remark: i have integrated GET2Line in a browser with Glamour.
Thanks

Hi Fabrice,
We have known this bug for quite some time. Actually, this is this bug which has motivated us to start Charter.
I suggest you to complete drop GraphET2 and focus on Charter. Here is an example: -=-=-=-=-=-=-=-=-=-=-=-=-=-=-=-=-=-=-=-= b := RTCharterBuilder new. b extent: 300 @ 300. b shape rectangle size: 0. b points: (0 to: 100). b allY: [ :x | x * x ]. b allX: #yourself. b connectDotColor: Color gray. b axisXTitled: 'X'; axisYTitled: 'Y'. b build -=-=-=-=-=-=-=-=-=-=-=-=-=-=-=-=-=-=-=-=
It produces the following:
Let us know how we can help you to migrate your code from GraphET2 to Charter.
Cheers, Alexandre
On Sep 19, 2014, at 6:24 AM, Fabrice Atrevi atrevifabrice@gmail.com wrote:
Hi, I face a bug in the labelling of x-axis with GET2Line in graphET2. For example, with this code:
| builder | builder := GET2Line data: (0 to: 100). builder y: [ :x | x*x ]; dotSize: 10. builder open
I got the first screenshot.
With another example, i note that, the X-Axis take the right value, but the label is not correct.
| bg| data class== KETimeSeries ifTrue:[ bg := GET2Line new view: each; data: (data index). bg x: [:e | (data index) at: e]; y: [ :x | data at: x]; title:'Graph of compartment ' ,(donne keyAtValue: data); lineWidth: 2; height: 200; width: 500. bg interaction popupText. bg build.
The second screenshot show that, when i point the value "24.35" on the x-axis, i get "50" because i use "interaction popupText". The third screenshot show what i got with another builder.
Remark: i have integrated GET2Line in a browser with Glamour.
Thanks
-- ATREVI D. Fabrice Master en Informatique A l'Institut de la Francophonie pour l'Informatique (IFI/Hanoï) <cap1.PNG><cap2.png><cap3.png>_______________________________________________ Moose-dev mailing list Moose-dev@iam.unibe.ch https://www.iam.unibe.ch/mailman/listinfo/moose-dev
-
 Alexandre Bergel
 -
 Fabrice Atrevi