
Hi!
Here is a post that describe how to have dates on the X-axis. This has been a recurrent problem, which is why I would like to share it with you.
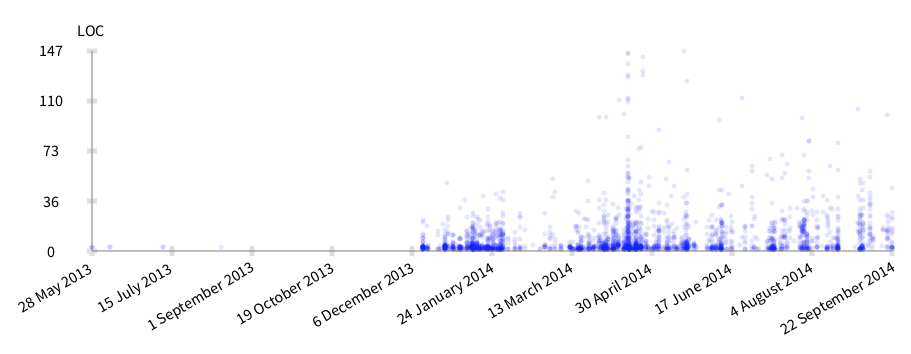
Dates are particular values that requires an adequate control over what is being displayed on X-axis. The julianDayNumber converts a date into a number.
-=-=-=-=-=-=-=-=-=-=-=-=-=-=-=-=-=-=-=-= methods := RTObject withAllSubclasses flatCollect: #methods. methods := methods reject: [ :m | m numberOfLinesOfCode > 150 ]. oldestMethod := methods minFor: #date.
b := RTCharterBuilder new. b extent: 800 @ 200. b shape circle size: 5; color: (Color blue alpha: 0.1). b interaction popup. b points: methods. b allY: #numberOfLinesOfCode. b allX: [ :m | m date julianDayNumber - oldestMethod date julianDayNumber ].
b axisConfiguration noDecimals; title: 'LOC'. b axisY. b axisConfiguration title: ''; labelRotation: -30; numberOfTicks: 10; numberOfLabels: 10; labelConvertion: [ :v | (Date julianDayNumber: v + oldestMethod date julianDayNumber) ]. b axisX.
b build -=-=-=-=-=-=-=-=-=-=-=-=-=-=-=-=-=-=-=-=
Cheers, Alexandre

Hi Alexandre,
This seems related with other question I have made on the Pharo list about visualizing the history of a SmalltalkHub repository, so I gave it a shot, but when I paste the code "minFor:" and "labelRotaion:" are in red. Need I to update something? (system update keep them red).
Cheers,
Offray
On 09/22/2014 03:31 PM, Alexandre Bergel wrote:
Hi!
Here is a post that describe how to have dates on the X-axis. This has been a recurrent problem, which is why I would like to share it with you.
Dates are particular values that requires an adequate control over what is being displayed on X-axis. The julianDayNumber converts a date into a number.
-=-=-=-=-=-=-=-=-=-=-=-=-=-=-=-=-=-=-=-= methods := RTObject withAllSubclasses flatCollect: #methods. methods := methods reject: [ :m | m numberOfLinesOfCode > 150 ]. oldestMethod := methods minFor: #date.
b := RTCharterBuilder new. b extent: 800 @ 200. b shape circle size: 5; color: (Color blue alpha: 0.1). b interaction popup. b points: methods. b allY: #numberOfLinesOfCode. b allX: [ :m | m date julianDayNumber - oldestMethod date julianDayNumber ].
b axisConfiguration noDecimals; title: 'LOC'. b axisY. b axisConfiguration title: ''; labelRotation: -30; numberOfTicks: 10; numberOfLabels: 10; labelConvertion: [ :v | (Date julianDayNumber: v + oldestMethod date julianDayNumber) ]. b axisX.
b build
Cheers, Alexandre -- _,.;:~^~:;._,.;:~^~:;._,.;:~^~:;._,.;:~^~:;._,.;: Alexandre Bergel http://www.bergel.eu ^~:;._,.;:~^~:;._,.;:~^~:;._,.;:~^~:;._,.;:~^~:;.
Moose-dev mailing list Moose-dev@iam.unibe.ch https://www.iam.unibe.ch/mailman/listinfo/moose-dev
Yes, you need to update Roassal2. You can use the Monticello browser for this, or simply download a new image (Moose 5.0 beta image) #minFor: is defined on the class Collection
What do you mean by “system update” ?
Cheers, Alexandre
Alexandre,
On 09/23/2014 03:50 PM, Alexandre Bergel wrote:
Yes, you need to update Roassal2. You can use the Monticello browser for this, or simply download a new image (Moose 5.0 beta image https://ci.inria.fr/moose/job/moose-5.0/lastSuccessfulBuild/artifact/moose-5.0.zip) #minFor: is defined on the class Collection
Thanks it worked like a charm! Here is the screenshot:
[1] http://mutabit.com/deltas/repos.fossil/grafoscopio-escritos/doc/tip/Figuras/...
It's also nice to notice that now I'm able to save this code inside a "notebook" created/stored inside Pharo itself:
[2] http://www.enlightenment.org/ss/e-5423297ee88c18.64873528.jpg
This notebook can be exported in STON, Markdown directly and pdf via pandoc, as you can see here:
[3] http://www.enlightenment.org/ss/e-54203e5c1de6e7.91406521.jpg [4] http://www.enlightenment.org/ss/e-54232be72039d8.73743775.jpg
So, is a really nice to be able to use Pharo itself to document the learning on this community and get so much help from all of you. Thanks again.
What do you mean by “system update” ?
The option you get from World Menu > System > Software Update.
Cheers, Alexandre
Cheers,
Offray
So, is a really nice to be able to use Pharo itself to document the learning on this community and get so much help from all of you. Thanks again.
You’re very welcome! Your experience is really important for the community.
What do you mean by “system update” ?
The option you get from World Menu > System > Software Update.
I have never used this. This is not the way to update Roassal :-)
Alexandre

Thank you Alex.
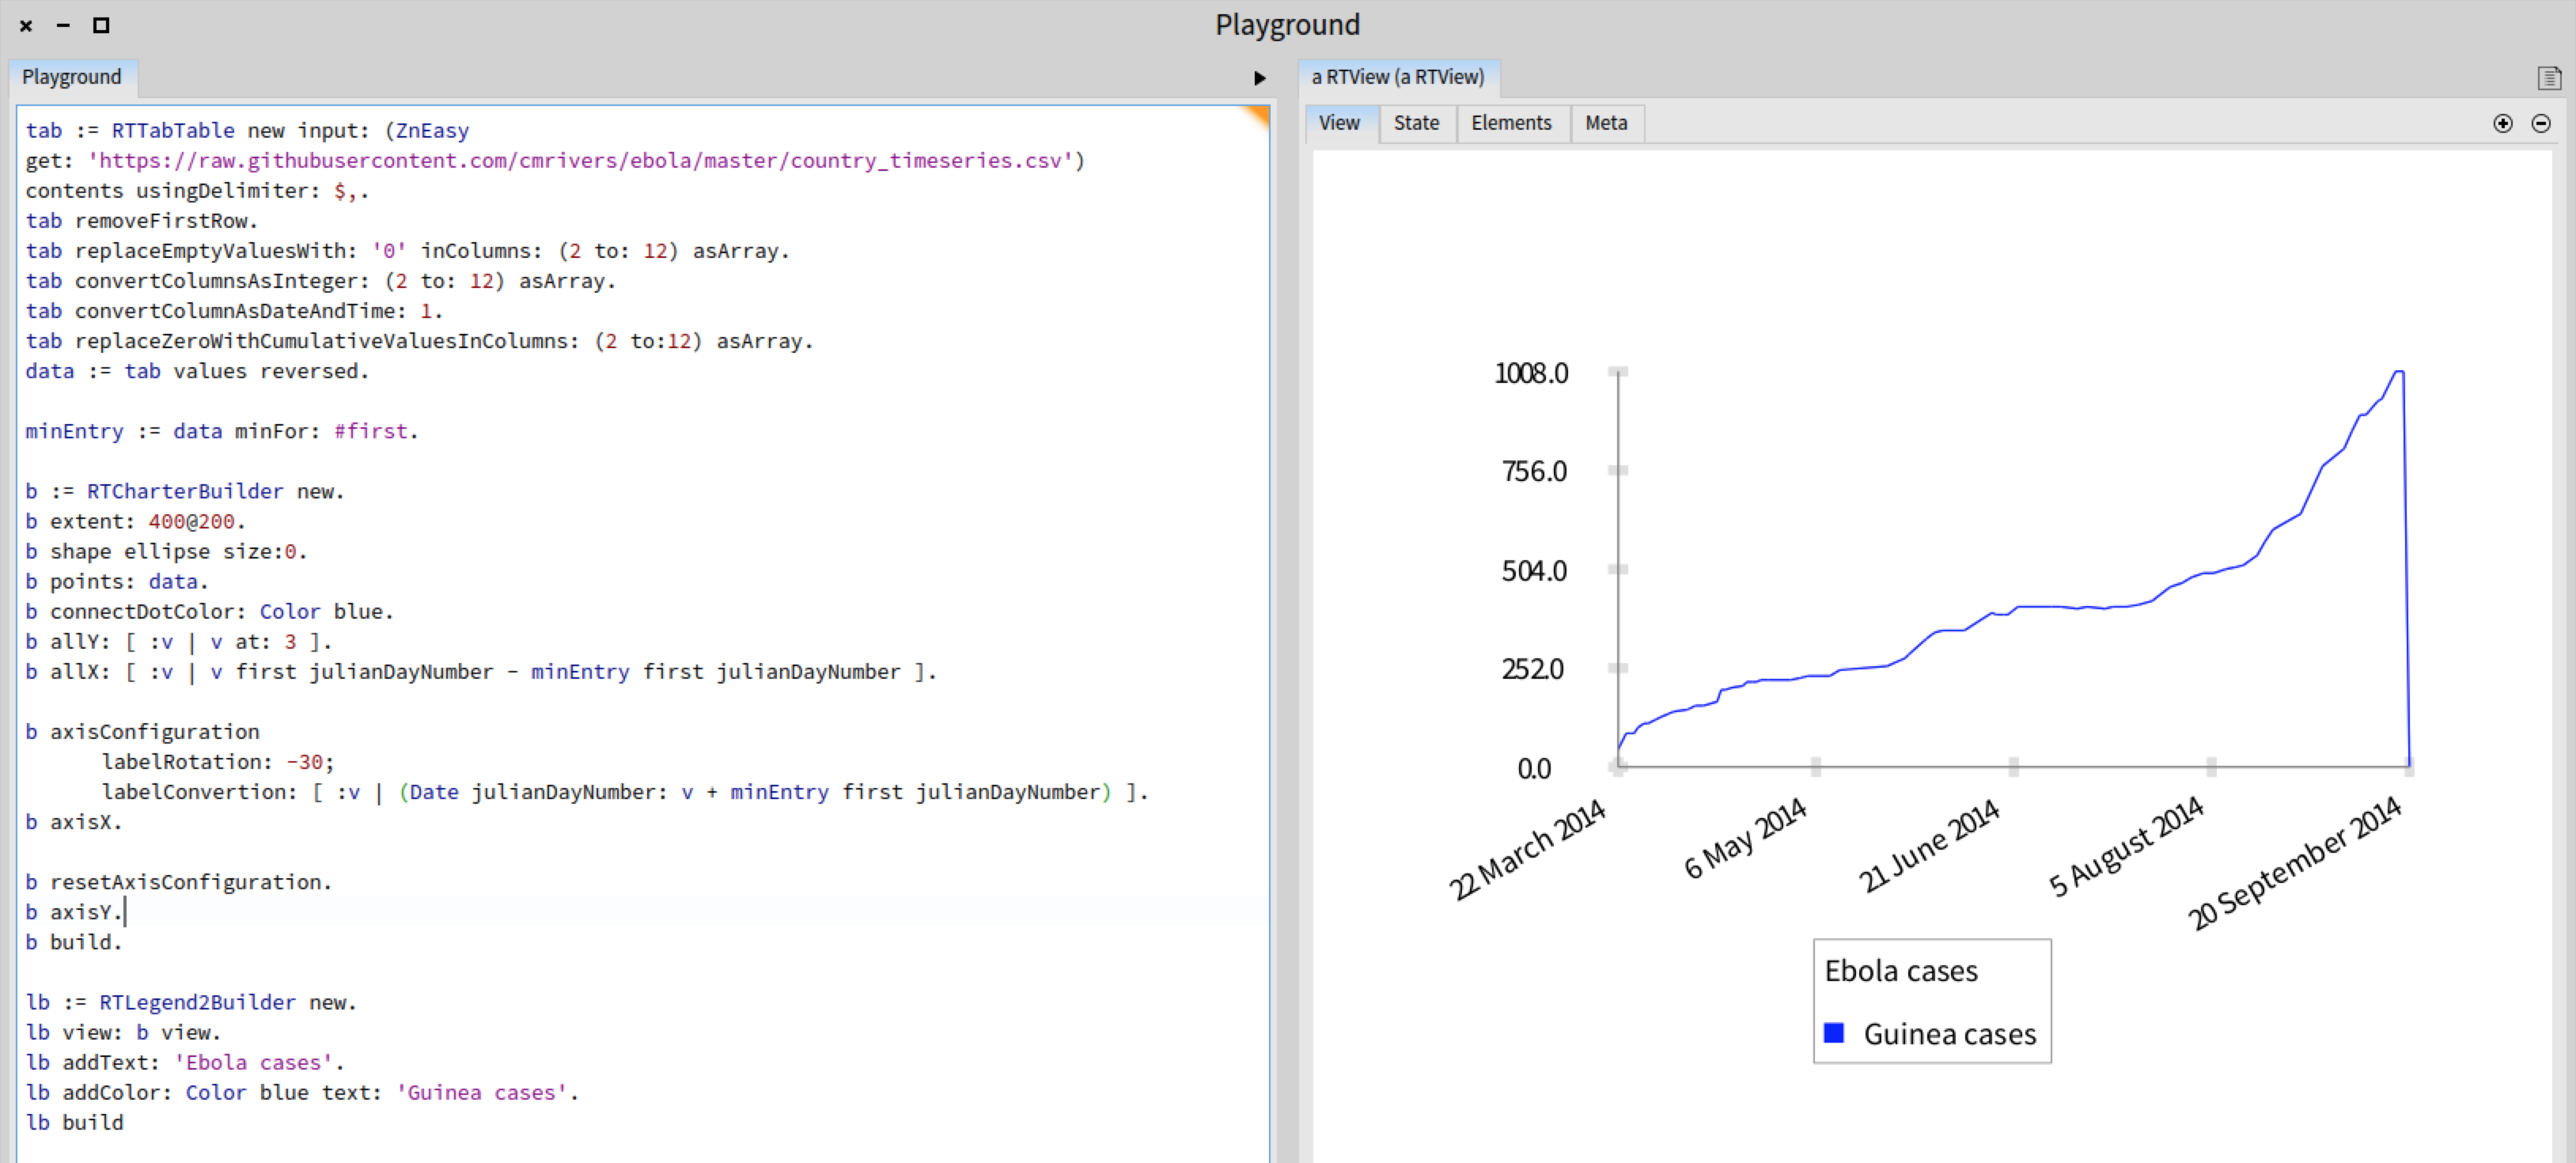
I was able to plot some nice Ebola cases very easily now:
================================================================ tab := RTTabTable new input: (ZnEasy get: ' https://raw.githubusercontent.com/cmrivers/ebola/master/country_timeseries.c... ') contents usingDelimiter: $,. tab removeFirstRow. tab replaceEmptyValuesWith: '0' inColumns: (2 to: 12) asArray. tab convertColumnsAsInteger: (2 to: 12) asArray. tab convertColumnAsDateAndTime: 1. tab replaceZeroWithCumulativeValuesInColumns: (2 to:12) asArray. data := tab values reversed.
minEntry := data minFor: #first.
b := RTCharterBuilder new. b extent: 400@200. b shape ellipse size:0. b points: data. b connectDotColor: Color blue. b allY: [ :v | v at: 3 ]. b allX: [ :v | v first julianDayNumber - minEntry first julianDayNumber ].
b axisConfiguration labelRotation: -30; labelConvertion: [ :v | (Date julianDayNumber: v + minEntry first julianDayNumber) ]. b axisX.
b resetAxisConfiguration. b axisY. b build.
lb := RTLegend2Builder new. lb view: b view. lb addText: 'Ebola cases'. lb addColor: Color blue text: 'Guinea cases'. lb build ================================================================
[image: Inline image 2]
On Mon, Sep 22, 2014 at 10:31 PM, Alexandre Bergel alexandre.bergel@me.com wrote:
Hi!
Here is a post that describe how to have dates on the X-axis. This has been a recurrent problem, which is why I would like to share it with you.
Dates are particular values that requires an adequate control over what is being displayed on X-axis. The julianDayNumber converts a date into a number.
-=-=-=-=-=-=-=-=-=-=-=-=-=-=-=-=-=-=-=-= methods := RTObject withAllSubclasses flatCollect: #methods. methods := methods reject: [ :m | m numberOfLinesOfCode > 150 ]. oldestMethod := methods minFor: #date.
b := RTCharterBuilder new. b extent: 800 @ 200. b shape circle size: 5; color: (Color blue alpha: 0.1). b interaction popup. b points: methods. b allY: #numberOfLinesOfCode. b allX: [ :m | m date julianDayNumber - oldestMethod date julianDayNumber ].
b axisConfiguration noDecimals; title: 'LOC'. b axisY. b axisConfiguration title: ''; labelRotation: -30; numberOfTicks: 10; numberOfLabels: 10; labelConvertion: [ :v | (Date julianDayNumber: v + oldestMethod date julianDayNumber) ]. b axisX.
b build
Cheers, Alexandre -- _,.;:~^~:;._,.;:~^~:;._,.;:~^~:;._,.;:~^~:;._,.;: Alexandre Bergel http://www.bergel.eu ^~:;._,.;:~^~:;._,.;:~^~:;._,.;:~^~:;._,.;:~^~:;.
Moose-dev mailing list Moose-dev@iam.unibe.ch https://www.iam.unibe.ch/mailman/listinfo/moose-dev
Impressive graph!
Alexandre
Just for the record, RTLegend2Builder has been renamed into RTLegendBuilder
Alexandre
On Sep 23, 2014, at 5:48 PM, Alexandre Bergel alexandre.bergel@me.com wrote:
Impressive graph!
Alexandre
_,.;:~^~:;._,.;:~^~:;._,.;:~^~:;._,.;:~^~:;._,.;: Alexandre Bergel http://www.bergel.eu ^~:;._,.;:~^~:;._,.;:~^~:;._,.;:~^~:;._,.;:~^~:;.
On Sep 23, 2014, at 6:13 AM, Serge Stinckwich serge.stinckwich@gmail.com wrote:
Thank you Alex.
I was able to plot some nice Ebola cases very easily now:
================================================================ tab := RTTabTable new input: (ZnEasy get: 'https://raw.githubusercontent.com/cmrivers/ebola/master/country_timeseries.c...') contents usingDelimiter: $,. tab removeFirstRow. tab replaceEmptyValuesWith: '0' inColumns: (2 to: 12) asArray. tab convertColumnsAsInteger: (2 to: 12) asArray. tab convertColumnAsDateAndTime: 1. tab replaceZeroWithCumulativeValuesInColumns: (2 to:12) asArray. data := tab values reversed.
minEntry := data minFor: #first.
b := RTCharterBuilder new. b extent: 400@200. b shape ellipse size:0. b points: data. b connectDotColor: Color blue. b allY: [ :v | v at: 3 ]. b allX: [ :v | v first julianDayNumber - minEntry first julianDayNumber ].
b axisConfiguration labelRotation: -30; labelConvertion: [ :v | (Date julianDayNumber: v + minEntry first julianDayNumber) ]. b axisX.
b resetAxisConfiguration. b axisY. b build.
lb := RTLegend2Builder new. lb view: b view. lb addText: 'Ebola cases'. lb addColor: Color blue text: 'Guinea cases'. lb build ================================================================
<Screen Shot 2014-09-23 at 11.03.04.png>
On Mon, Sep 22, 2014 at 10:31 PM, Alexandre Bergel alexandre.bergel@me.com wrote: Hi!
Here is a post that describe how to have dates on the X-axis. This has been a recurrent problem, which is why I would like to share it with you.
Dates are particular values that requires an adequate control over what is being displayed on X-axis. The julianDayNumber converts a date into a number.
-=-=-=-=-=-=-=-=-=-=-=-=-=-=-=-=-=-=-=-= methods := RTObject withAllSubclasses flatCollect: #methods. methods := methods reject: [ :m | m numberOfLinesOfCode > 150 ]. oldestMethod := methods minFor: #date.
b := RTCharterBuilder new. b extent: 800 @ 200. b shape circle size: 5; color: (Color blue alpha: 0.1). b interaction popup. b points: methods. b allY: #numberOfLinesOfCode. b allX: [ :m | m date julianDayNumber - oldestMethod date julianDayNumber ].
b axisConfiguration noDecimals; title: 'LOC'. b axisY. b axisConfiguration title: ''; labelRotation: -30; numberOfTicks: 10; numberOfLabels: 10; labelConvertion: [ :v | (Date julianDayNumber: v + oldestMethod date julianDayNumber) ]. b axisX.
b build
<Screen Shot 2014-09-22 at 5.23.22 PM.png> Cheers, Alexandre -- _,.;:~^~:;._,.;:~^~:;._,.;:~^~:;._,.;:~^~:;._,.;: Alexandre Bergel http://www.bergel.eu ^~:;._,.;:~^~:;._,.;:~^~:;._,.;:~^~:;._,.;:~^~:;.
Moose-dev mailing list Moose-dev@iam.unibe.ch https://www.iam.unibe.ch/mailman/listinfo/moose-dev
-- Serge Stinckwich UCBN & UMI UMMISCO 209 (IRD/UPMC) Every DSL ends up being Smalltalk http://www.doesnotunderstand.org/ _______________________________________________ Moose-dev mailing list Moose-dev@iam.unibe.ch https://www.iam.unibe.ch/mailman/listinfo/moose-dev
Moose-dev mailing list Moose-dev@iam.unibe.ch https://www.iam.unibe.ch/mailman/listinfo/moose-dev
Hi Serge,
I see that your graph has two texts, 'Ebola cases' and 'Guinea cases', but I get only one blue line colored plot. Is that the intended, and what these two labels means? (particularly Guinea cases).
Cheers,
Offray
On 09/23/2014 04:13 AM, Serge Stinckwich wrote:
Thank you Alex.
I was able to plot some nice Ebola cases very easily now:
================================================================ tab := RTTabTable new input: (ZnEasy get: 'https://raw.githubusercontent.com/cmrivers/ebola/master/country_timeseries.c...') contents usingDelimiter: $,. tab removeFirstRow. tab replaceEmptyValuesWith: '0' inColumns: (2 to: 12) asArray. tab convertColumnsAsInteger: (2 to: 12) asArray. tab convertColumnAsDateAndTime: 1. tab replaceZeroWithCumulativeValuesInColumns: (2 to:12) asArray. data := tab values reversed.
minEntry := data minFor: #first.
b := RTCharterBuilder new. b extent: 400@200. b shape ellipse size:0. b points: data. b connectDotColor: Color blue. b allY: [ :v | v at: 3 ]. b allX: [ :v | v first julianDayNumber - minEntry first julianDayNumber ].
b axisConfiguration labelRotation: -30; labelConvertion: [ :v | (Date julianDayNumber: v + minEntry first julianDayNumber) ]. b axisX.
b resetAxisConfiguration. b axisY. b build.
lb := RTLegend2Builder new. lb view: b view. lb addText: 'Ebola cases'. lb addColor: Color blue text: 'Guinea cases'. lb build ================================================================
Inline image 2
On Mon, Sep 22, 2014 at 10:31 PM, Alexandre Bergel <alexandre.bergel@me.com mailto:alexandre.bergel@me.com> wrote:
 Hi!

 Here is a post that describe how to have dates on the X-axis.
 This has been a recurrent problem, which is why I would like to share it
 with you.

 Dates are particular values that requires an adequate control over what is
 being displayed on X-axis. The julianDayNumber converts a date into a number.

 -=-=-=-=-=-=-=-=-=-=-=-=-=-=-=-=-=-=-=-=
 methods := RTObject withAllSubclasses flatCollect: #methods.
 methods := methods reject: [ :m | m numberOfLinesOfCode > 150 ].
 oldestMethod := methods minFor: #date.

 b := RTCharterBuilder new.
 b extent: 800 @ 200.
 b shape circle size: 5; color: (Color blue alpha: 0.1).
 b interaction popup.
 b points: methods.
 b allY: #numberOfLinesOfCode.
 b allX: [ :m | m date julianDayNumber - oldestMethod date julianDayNumber ].

 b axisConfiguration
 noDecimals;
 title: 'LOC'.
 b axisY.
 b axisConfiguration
 title: '';
 labelRotation: -30;
 numberOfTicks: 10;
 numberOfLabels: 10;
 labelConvertion: [ :v | (Date julianDayNumber: v + oldestMethod date
 julianDayNumber) ].
 b axisX.

 b build
 -=-=-=-=-=-=-=-=-=-=-=-=-=-=-=-=-=-=-=-=
 Cheers,
 Alexandre
 --
 _,.;:~^~:;._,.;:~^~:;._,.;:~^~:;._,.;:~^~:;._,.;:
 Alexandre Bergel http://www.bergel.eu
 ^~:;._,.;:~^~:;._,.;:~^~:;._,.;:~^~:;._,.;:~^~:;.


 _______________________________________________
 Moose-dev mailing list
 Moose-dev@iam.unibe.ch <mailto:Moose-dev@iam.unibe.ch>
 https://www.iam.unibe.ch/mailman/listinfo/moose-dev
-- Serge Stinckwich UCBN & UMI UMMISCO 209 (IRD/UPMC) Every DSL ends up being Smalltalk http://www.doesnotunderstand.org/
Moose-dev mailing list Moose-dev@iam.unibe.ch https://www.iam.unibe.ch/mailman/listinfo/moose-dev
On Thu, Sep 25, 2014 at 6:41 PM, Offray Vladimir Luna Cárdenas offray@riseup.net wrote:
Hi Serge,
I see that your graph has two texts, 'Ebola cases' and 'Guinea cases', but I get only one blue line colored plot. Is that the intended, and what these two labels means? (particularly Guinea cases).
My idea was to plot many curve for each country (not done in this script). The first label is the text of the legend, the second one, the name of the blue curve.
This is an example with two countries: ===================================================
tab := RTTabTable new input: (ZnEasy get: 'https://raw.githubusercontent.com/cmrivers/ebola/master/country_timeseries.c...') contents usingDelimiter: $,. tab removeFirstRow. tab replaceEmptyValuesWith: '0' inColumns: (2 to: 12) asArray. tab convertColumnsAsInteger: (2 to: 12) asArray. tab convertColumnAsDateAndTime: 1. tab replaceZeroWithCumulativeValuesInColumns: (2 to:12) asArray. data := tab values reversed.
minEntry := data minFor: #first.
b := RTCharterBuilder new. b extent: 400@200. b shape ellipse size:0. b points: data. b connectDotColor: Color blue. b allY: [ :v | v at: 3 ]. b allX: [ :v | v first julianDayNumber - minEntry first julianDayNumber ].
b points: data. b connectDotColor: Color green. b allY: [ :v | v at: 4 ]. b allX: [ :v | v first julianDayNumber - minEntry first julianDayNumber ].
b axisConfiguration labelRotation: -30; labelConvertion: [ :v | (Date julianDayNumber: v + minEntry first julianDayNumber) ]. b axisX.
b resetAxisConfiguration. b axisY. b build.
lb := RTLegend2Builder new. lb view: b view. lb addText: 'Ebola cases'. lb addColor: Color blue text: 'Guinea'. lb addColor: Color green text: 'Liberia'. lb build. b open. ===================================================
Regards,
Hi Serge,
The script you have sent does not work well. Curves are not in the graphs :-( I think Bui has produce graphs that correctly use Charter
Do you have the version Bui produced?
Cheers, Alexandre
On Sep 29, 2014, at 7:31 AM, Serge Stinckwich serge.stinckwich@gmail.com wrote:
On Thu, Sep 25, 2014 at 6:41 PM, Offray Vladimir Luna Cárdenas offray@riseup.net wrote:
Hi Serge,
I see that your graph has two texts, 'Ebola cases' and 'Guinea cases', but I get only one blue line colored plot. Is that the intended, and what these two labels means? (particularly Guinea cases).
My idea was to plot many curve for each country (not done in this script). The first label is the text of the legend, the second one, the name of the blue curve.
This is an example with two countries:
tab := RTTabTable new input: (ZnEasy get: 'https://raw.githubusercontent.com/cmrivers/ebola/master/country_timeseries.c...') contents usingDelimiter: $,. tab removeFirstRow. tab replaceEmptyValuesWith: '0' inColumns: (2 to: 12) asArray. tab convertColumnsAsInteger: (2 to: 12) asArray. tab convertColumnAsDateAndTime: 1. tab replaceZeroWithCumulativeValuesInColumns: (2 to:12) asArray. data := tab values reversed.
minEntry := data minFor: #first.
b := RTCharterBuilder new. b extent: 400@200. b shape ellipse size:0. b points: data. b connectDotColor: Color blue. b allY: [ :v | v at: 3 ]. b allX: [ :v | v first julianDayNumber - minEntry first julianDayNumber ].
b points: data. b connectDotColor: Color green. b allY: [ :v | v at: 4 ]. b allX: [ :v | v first julianDayNumber - minEntry first julianDayNumber ].
b axisConfiguration labelRotation: -30; labelConvertion: [ :v | (Date julianDayNumber: v + minEntry first julianDayNumber) ]. b axisX.
b resetAxisConfiguration. b axisY. b build.
lb := RTLegend2Builder new. lb view: b view. lb addText: 'Ebola cases'. lb addColor: Color blue text: 'Guinea'. lb addColor: Color green text: 'Liberia'. lb build. b open. ===================================================
Regards,
Serge Stinckwich UCBN & UMI UMMISCO 209 (IRD/UPMC) Every DSL ends up being Smalltalk http://www.doesnotunderstand.org/
Moose-dev mailing list Moose-dev@iam.unibe.ch https://www.iam.unibe.ch/mailman/listinfo/moose-dev
Hi Alex,
We will start to work on the challenge this morning with Mai Anh. I already made a list of issues regarding enhancements can could implemented for Kendrick (including visualisations): https://github.com/UMMISCO/Kendrick/issues
We will made some report from time to time.
Thank you for your help. Regards,
On Mon, Oct 6, 2014 at 3:36 AM, Alexandre Bergel alexandre.bergel@me.com wrote:
Hi Serge,
The script you have sent does not work well. Curves are not in the graphs :-( I think Bui has produce graphs that correctly use Charter
Do you have the version Bui produced?
Cheers, Alexandre
On Sep 29, 2014, at 7:31 AM, Serge Stinckwich serge.stinckwich@gmail.com wrote:
On Thu, Sep 25, 2014 at 6:41 PM, Offray Vladimir Luna Cárdenas offray@riseup.net wrote:
Hi Serge,
I see that your graph has two texts, 'Ebola cases' and 'Guinea cases', but I get only one blue line colored plot. Is that the intended, and what these two labels means? (particularly Guinea cases).
My idea was to plot many curve for each country (not done in this script). The first label is the text of the legend, the second one, the name of the blue curve.
This is an example with two countries:
tab := RTTabTable new input: (ZnEasy get: 'https://raw.githubusercontent.com/cmrivers/ebola/master/country_timeseries.c...') contents usingDelimiter: $,. tab removeFirstRow. tab replaceEmptyValuesWith: '0' inColumns: (2 to: 12) asArray. tab convertColumnsAsInteger: (2 to: 12) asArray. tab convertColumnAsDateAndTime: 1. tab replaceZeroWithCumulativeValuesInColumns: (2 to:12) asArray. data := tab values reversed.
minEntry := data minFor: #first.
b := RTCharterBuilder new. b extent: 400@200. b shape ellipse size:0. b points: data. b connectDotColor: Color blue. b allY: [ :v | v at: 3 ]. b allX: [ :v | v first julianDayNumber - minEntry first julianDayNumber ].
b points: data. b connectDotColor: Color green. b allY: [ :v | v at: 4 ]. b allX: [ :v | v first julianDayNumber - minEntry first julianDayNumber ].
b axisConfiguration labelRotation: -30; labelConvertion: [ :v | (Date julianDayNumber: v + minEntry first julianDayNumber) ]. b axisX.
b resetAxisConfiguration. b axisY. b build.
lb := RTLegend2Builder new. lb view: b view. lb addText: 'Ebola cases'. lb addColor: Color blue text: 'Guinea'. lb addColor: Color green text: 'Liberia'. lb build. b open. ===================================================
Regards,
Serge Stinckwich UCBN & UMI UMMISCO 209 (IRD/UPMC) Every DSL ends up being Smalltalk http://www.doesnotunderstand.org/
Moose-dev mailing list Moose-dev@iam.unibe.ch https://www.iam.unibe.ch/mailman/listinfo/moose-dev
-- _,.;:~^~:;._,.;:~^~:;._,.;:~^~:;._,.;:~^~:;._,.;: Alexandre Bergel http://www.bergel.eu ^~:;._,.;:~^~:;._,.;:~^~:;._,.;:~^~:;._,.;:~^~:;.
Moose-dev mailing list Moose-dev@iam.unibe.ch https://www.iam.unibe.ch/mailman/listinfo/moose-dev
That is a lot :-)
Bui told me it would be useful to have expansion of Graph nodes. This is something we can easily do. We are working on this now..
Cheers, Alexandre
On Tue, Oct 7, 2014 at 4:43 PM, Alexandre Bergel alexandre.bergel@me.com wrote:
That is a lot :-)
Yes ;-)
Bui told me it would be useful to have expansion of Graph nodes. This is something we can easily do. We are working on this now..
Ok great ! We can wait on this one, not really urgent. Thank you.
-
 Alexandre Bergel
 -
 Offray Vladimir Luna Cárdenas
 -
 Serge Stinckwich