
Hi guys,
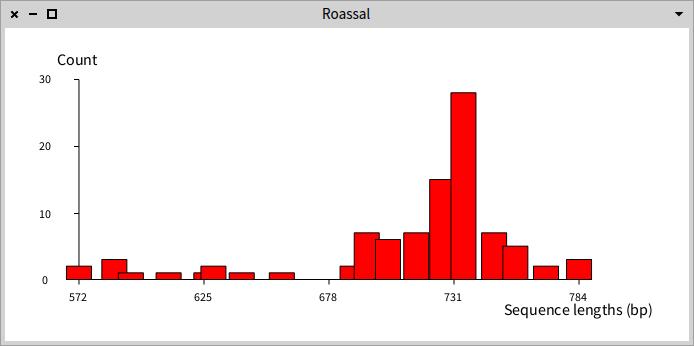
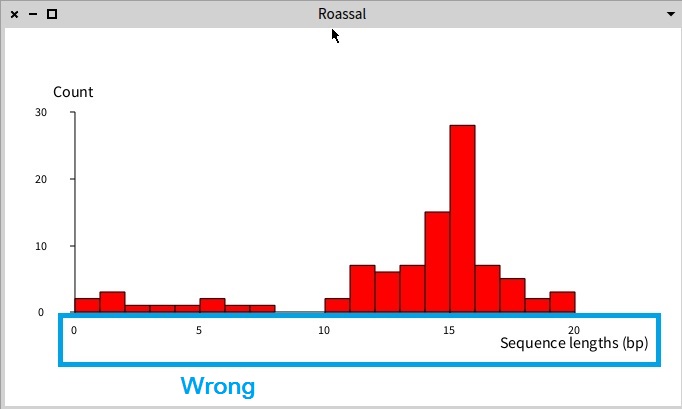
I am experiencing a problem visualizing histograms in Roassal with Pharo 5. In the attached image you can observe the first bar shape starts from a negative X axis value, where I want to start from 0. Besides, some bars are gapped but I don't know why.
I am using with the following code:
| bins minPoint g ds |
bins := self groupedBySeqLengthDistribution: binNumber. minPoint := ((bins reject: #isEmpty) detectMin: [ : c | c size ]) anyOne size.
" Build diagram " g := RTGrapher new extent: 500 @ 200; minX: minPoint; withoutOrigin; yourself. ds := RTData new points: bins; x: [ : c | c ifEmpty: [ minPoint ] ifNotEmpty: [ : d | d anyOne size ] ]; y: #size. ds barShape borderColor: Color black; color: aColor; width: barWidth. g add: ds.
" Configure axis settings " g axisY title: axixYLabel; color: Color black; noDecimal. g axisX noDecimal; fromPoint: minPoint; color: Color black; title: axisXLabel. " Open visualization in a new window " g open.
Any idea what I am missing?
Cheers,
Hernán

Hi Hernán,
I am not sure what exactly is the problematic situation you describe. Why you cannot simply with with #minX: and #maxX: ?
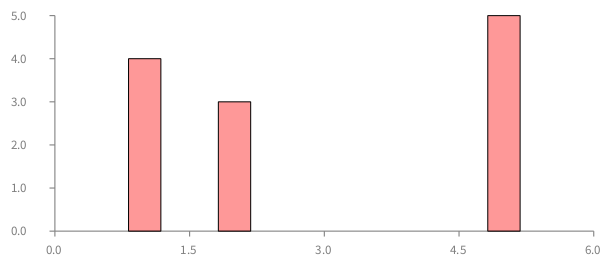
For example, I tried to reuse the code you have provided. I can have:
bins := #(#(1 1 1 1 ) #(2 2 2) #(5 5 5 5 5)).
minPoint := ((bins reject: #isEmpty) detectMin: [ : c | c size ])
anyOne.
" Build diagram "
g := RTGrapher new
        extent: 500 @ 200;
        minX: 0;
maxX: 6; withoutOrigin; yourself. ds := RTData new points: bins; x: [ : c | c ifEmpty: [ minPoint ] ifNotEmpty: [ : d | d anyOne ] ]; y: #size. ds barShape borderColor: Color black; color: Color red trans; width: 30. g add: ds.
g
But you can have "minX: 1", which in that case, the first bar is above the Y-Axis. This is what one would expect.
Which rendering do you wish to have? Can you provide a self-contained piece of code that I can run on my machine?
Cheers, Alexandre
Hi Alex
I attached another screenshot which describes exactly the problem.
2017-06-16 10:40 GMT-03:00 Alexandre Bergel alexandre.bergel@me.com:
Hi Hernán,
I am not sure what exactly is the problematic situation you describe. Why you cannot simply with with #minX: and #maxX: ?
My script actually sets minX: but it is wrongly drawn in the histogram
For example, I tried to reuse the code you have provided. I can have:
bins := #(#(1 1 1 1 ) #(2 2 2) #(5 5 5 5 5)). minPoint := ((bins reject: #isEmpty) detectMin: [ : c | c size ])anyOne.
" Build diagram " g := RTGrapher new extent: 500 @ 200; minX: 0;maxX: 6; withoutOrigin; yourself. ds := RTData new points: bins; x: [ : c | c ifEmpty: [ minPoint ] ifNotEmpty: [ : d | d anyOne ] ]; y: #size. ds barShape borderColor: Color black; color: Color red trans; width: 30. g add: ds.
gBut you can have "minX: 1", which in that case, the first bar is above the Y-Axis. This is what one would expect.
The problem is not positioning the bars above the Y-Axis, but positioning them in the X-Axis.
Which rendering do you wish to have? Can you provide a self-contained piece of code that I can run on my machine?
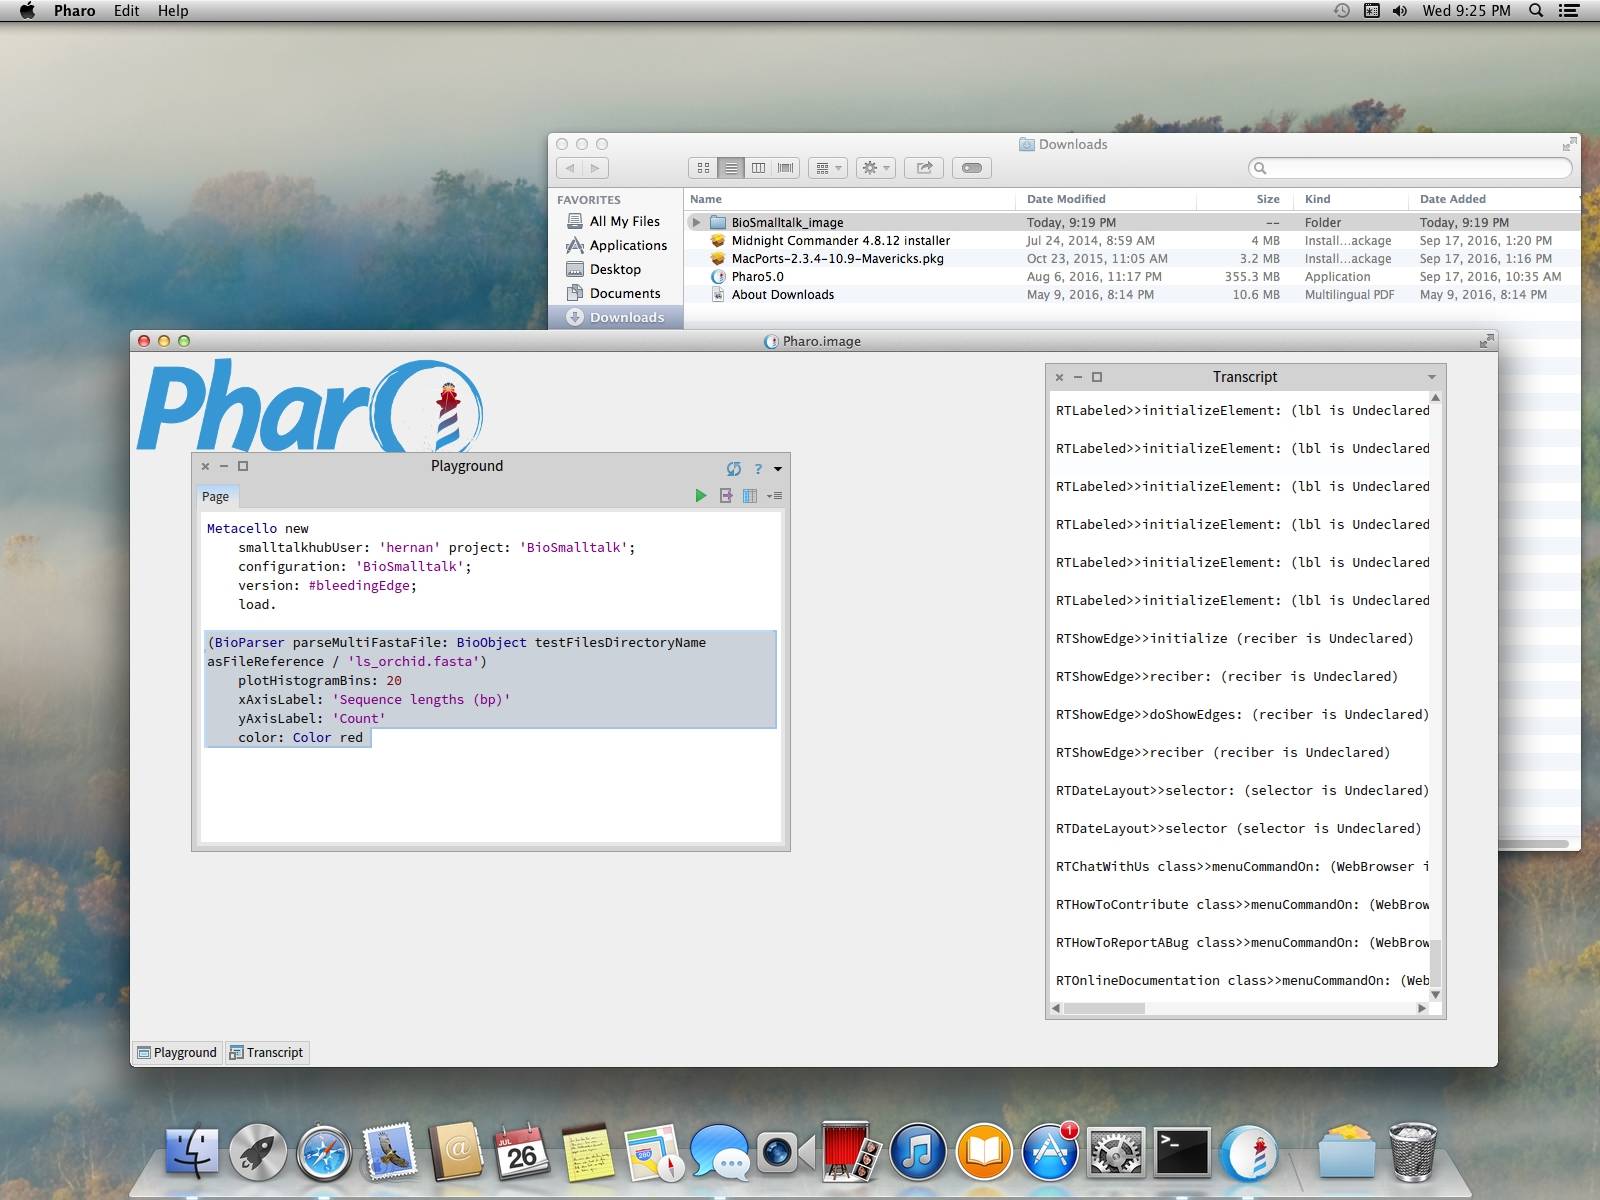
If you have some time you could install BioSmalltalk in Pharo 5 (I haven't tested Pharo 6 yet) and evaluate the problematic expression:
Metacello new smalltalkhubUser: 'hernan' project: 'BioSmalltalk'; configuration: 'BioSmalltalk'; version: #bleedingEdge; load
(BioParser parseMultiFastaFile: BioObject testFilesDirectoryName asFileReference / 'ls_orchid.fasta') plotHistogramBins: 20 xAxisLabel: 'Sequence lengths (bp)' yAxisLabel: 'Count' color: Color red
Cheers,
Hernán
Cheers,
Alexandre
_,.;:~^~:;._,.;:~^~:;._,.;:~^~:;._,.;:~^~:;._,.;: Alexandre Bergel http://www.bergel.eu ^~:;._,.;:~^~:;._,.;:~^~:;._,.;:~^~:;._,.;:~^~:;.
On Jun 15, 2017, at 1:16 AM, Hernán Morales Durand < hernan.morales@gmail.com> wrote:
Hi guys,
I am experiencing a problem visualizing histograms in Roassal with Pharo 5. In the attached image you can observe the first bar shape starts from a negative X axis value, where I want to start from 0. Besides, some bars are gapped but I don't know why.
I am using with the following code:
| bins minPoint g ds |

bins := self groupedBySeqLengthDistribution: binNumber.
minPoint := ((bins reject: #isEmpty) detectMin: [ : c | c size ])
anyOne size.
" Build diagram "
g := RTGrapher new
        extent: 500 @ 200;
        minX: minPoint;
        withoutOrigin;
        yourself.
ds := RTData new
    points: bins;
    x: [ : c | c ifEmpty: [ minPoint ] ifNotEmpty: [ : d | d anyOne
size ] ]; y: #size. ds barShape borderColor: Color black; color: aColor; width: barWidth. g add: ds.
" Configure axis settings "
g axisY
    title: axixYLabel;
    color: Color black;
    noDecimal.
g axisX
    noDecimal;
    fromPoint: minPoint;
    color: Color black;
    title: axisXLabel.
" Open visualization in a new window "
g open.
Any idea what I am missing?
Cheers,
Hernán <Roassal.jpeg>_______________________________________________ Moose-dev mailing list Moose-dev@list.inf.unibe.ch https://www.list.inf.unibe.ch/listinfo/moose-dev
Moose-dev mailing list Moose-dev@list.inf.unibe.ch https://www.list.inf.unibe.ch/listinfo/moose-dev
Hi Hernán,
Sorry to reply to late.
Can you update Roassal and try:
-=-=-=-=-=-=-=-=-= g := RTGrapher new.
ds := RTData new. ds barShape. ds points: #(1 2 3 -2). ds maxX: 10. g add: ds.
g configureForBarCharts.
g -=-=-=-=-=-=-=-=-=
The call configureforBarCharts should do what you expect.
Cheers, Alexandre
Hi Alex,
Thank you for taking care of this issue. The problem is partially fixed. I saw you implemented
configureForBarCharts
self datasets do: #offsetForBarCharts. self minX: 0.5. self maxX: self getMaxNumberOfPoints. self axisX noTick.
However, I want to display the ticks, so I borrowed the first 3 lines for my plot method :
plotHistogramBins: binNumber xAxisLabel: axisXLabel yAxisLabel:
axixYLabel color: aColor barWidth: barWidth
| bins minPoint g ds |
bins := self groupedBySeqLengthDistribution: binNumber. minPoint := ((bins reject: #isEmpty) detectMin: #size) anyOne size.
" Build diagram " g := RTGrapher new extent: 500 @ 200; minX: minPoint; withoutOrigin; yourself. ds := RTData new points: bins; x: [ : c | c ifEmpty: [ minPoint ] ifNotEmpty: [ : d | d anyOne size ] ]; y: #size. ds barShape borderColor: Color black; color: aColor; width: barWidth. g add: ds.
" Configure axis settings " g axisY title: axixYLabel; color: Color black; noDecimal. g axisX noDecimal; fromPoint: minPoint; color: Color black; title: axisXLabel.
g datasets do: #offsetForBarCharts. g minX: 0. g maxX: g getMaxNumberOfPoints.
" Open visualization in a new window " g open.
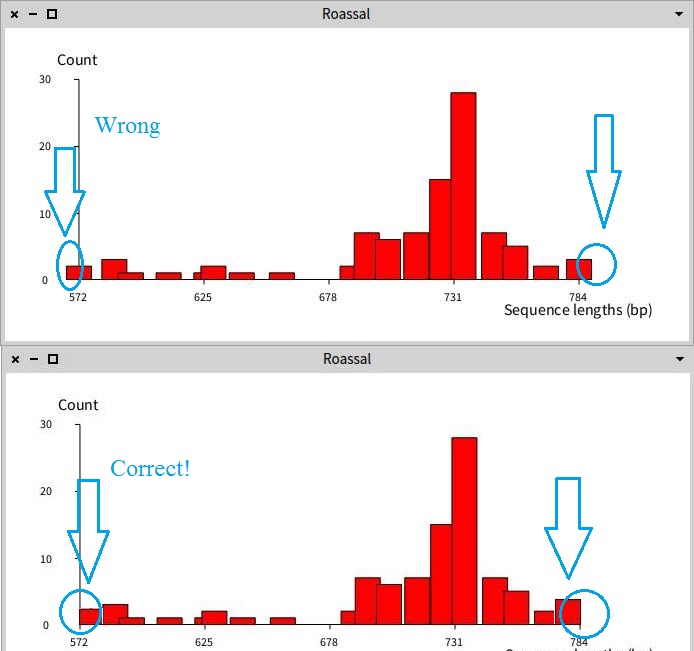
Now the shift problem is fixed, but I lost the sequence lengths in the X axis. Please see the two attached screenshots.
Cheers,
Hernán
2017-07-09 5:20 GMT-03:00 Alexandre Bergel alexandre.bergel@me.com:
Hi Hernán,
Sorry to reply to late.
Can you update Roassal and try:
-=-=-=-=-=-=-=-=-= g := RTGrapher new.
ds := RTData new. ds barShape. ds points: #(1 2 3 -2). ds maxX: 10. g add: ds.
g configureForBarCharts.
g
The call configureforBarCharts should do what you expect.
Cheers, Alexandre
-- _,.;:~^~:;._,.;:~^~:;._,.;:~^~:;._,.;:~^~:;._,.;: Alexandre Bergel http://www.bergel.eu ^~:;._,.;:~^~:;._,.;:~^~:;._,.;:~^~:;._,.;:~^~:;.
On Jun 16, 2017, at 4:35 PM, Hernán Morales Durand < hernan.morales@gmail.com> wrote:
Hi Alex
I attached another screenshot which describes exactly the problem.
2017-06-16 10:40 GMT-03:00 Alexandre Bergel alexandre.bergel@me.com: Hi Hernán,
I am not sure what exactly is the problematic situation you describe. Why you cannot simply with with #minX: and #maxX: ?
My script actually sets minX: but it is wrongly drawn in the histogram
For example, I tried to reuse the code you have provided. I can have:
bins := #(#(1 1 1 1 ) #(2 2 2) #(5 5 5 5 5)).
minPoint := ((bins reject: #isEmpty) detectMin: [ : c | c size ])
anyOne.
" Build diagram "
g := RTGrapher new
        extent: 500 @ 200;
        minX: 0;
maxX: 6; withoutOrigin; yourself. ds := RTData new points: bins; x: [ : c | c ifEmpty: [ minPoint ] ifNotEmpty: [ : d | d anyOne ] ]; y: #size. ds barShape borderColor: Color black; color: Color red trans; width: 30. g add: ds.
g<Screenshot 2017-06-16 09.39.25.png>
But you can have "minX: 1", which in that case, the first bar is above the Y-Axis. This is what one would expect.
The problem is not positioning the bars above the Y-Axis, but positioning them in the X-Axis.
Which rendering do you wish to have? Can you provide a self-contained piece of code that I can run on my machine?
If you have some time you could install BioSmalltalk in Pharo 5 (I haven't tested Pharo 6 yet) and evaluate the problematic expression: Metacello new smalltalkhubUser: 'hernan' project: 'BioSmalltalk'; configuration: 'BioSmalltalk'; version: #bleedingEdge; load
(BioParser parseMultiFastaFile: BioObject testFilesDirectoryName asFileReference / 'ls_orchid.fasta') plotHistogramBins: 20 xAxisLabel: 'Sequence lengths (bp)' yAxisLabel: 'Count' color: Color red
Cheers,
Hernán
Cheers, Alexandre -- _,.;:~^~:;._,.;:~^~:;._,.;:~^~:;._,.;:~^~:;._,.;: Alexandre Bergel http://www.bergel.eu ^~:;._,.;:~^~:;._,.;:~^~:;._,.;:~^~:;._,.;:~^~:;.
On Jun 15, 2017, at 1:16 AM, Hernán Morales Durand < hernan.morales@gmail.com> wrote:
Hi guys,
I am experiencing a problem visualizing histograms in Roassal with Pharo 5. In the attached image you can observe the first bar shape starts from a negative X axis value, where I want to start from 0. Besides, some bars are gapped but I don't know why.
I am using with the following code:
| bins minPoint g ds |

bins := self groupedBySeqLengthDistribution: binNumber.
minPoint := ((bins reject: #isEmpty) detectMin: [ : c | c size ])
anyOne size.
" Build diagram "
g := RTGrapher new
        extent: 500 @ 200;
        minX: minPoint;
        withoutOrigin;
        yourself.
ds := RTData new
    points: bins;
    x: [ : c | c ifEmpty: [ minPoint ] ifNotEmpty: [ : d | d anyOne
size ] ]; y: #size. ds barShape borderColor: Color black; color: aColor; width: barWidth. g add: ds.
" Configure axis settings "
g axisY
    title: axixYLabel;
    color: Color black;
    noDecimal.
g axisX
    noDecimal;
    fromPoint: minPoint;
    color: Color black;
    title: axisXLabel.
" Open visualization in a new window "
g open.
Any idea what I am missing?
Cheers,
Hernán <Roassal.jpeg>_______________________________________________ Moose-dev mailing list Moose-dev@list.inf.unibe.ch https://www.list.inf.unibe.ch/listinfo/moose-dev
Moose-dev mailing list Moose-dev@list.inf.unibe.ch https://www.list.inf.unibe.ch/listinfo/moose-dev
<unnamed.jpg>_______________________________________________ Moose-dev mailing list Moose-dev@list.inf.unibe.ch https://www.list.inf.unibe.ch/listinfo/moose-dev
Moose-dev mailing list Moose-dev@list.inf.unibe.ch https://www.list.inf.unibe.ch/listinfo/moose-dev
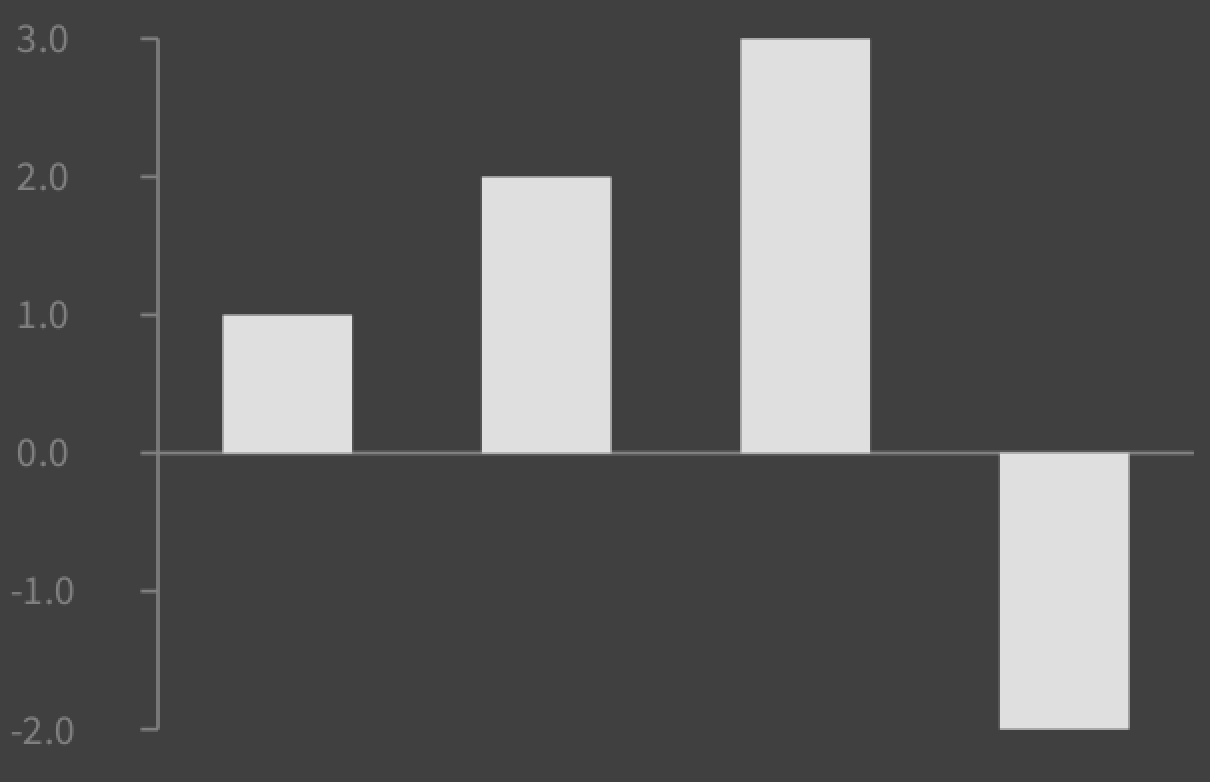
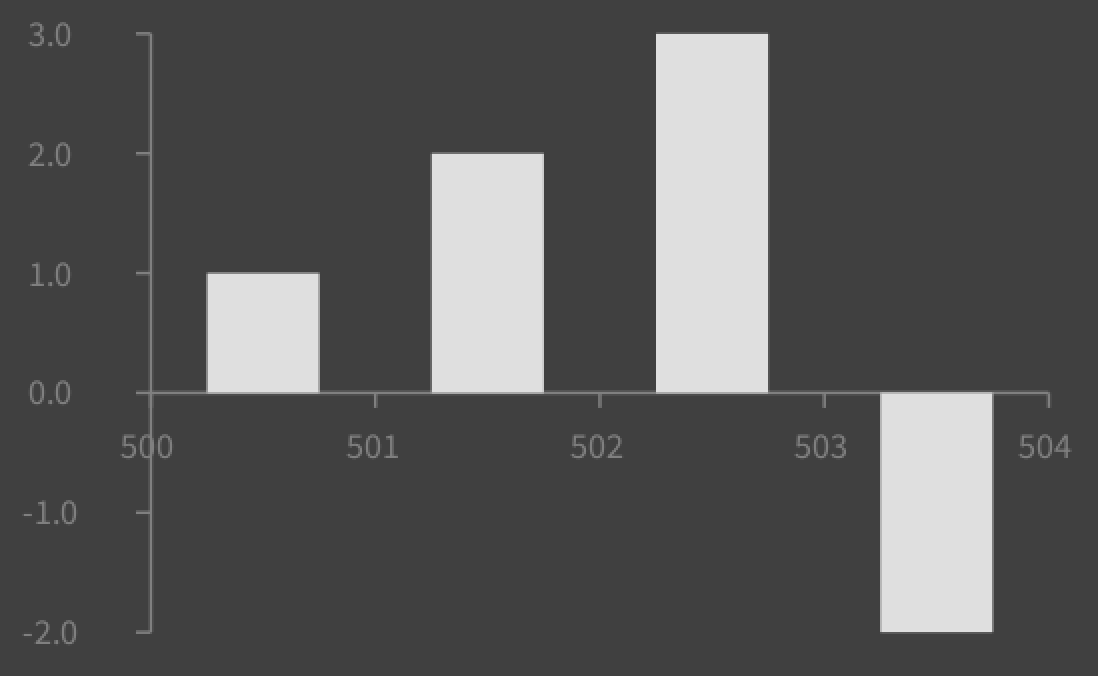
Consider the example: -=-=-=-=-=-=-=-=-= g := RTGrapher new.
ds := RTData new. ds barShape. ds points: #(1 2 3 -2). ds maxX: 10. g add: ds.
g configureForBarCharts. g axisX numberOfLabels: 4; labelConversion: [ :value | value + 500 ].
g -=-=-=-=-=-=-=-=-=
Does this solve your problem?
Cheers, Alexandre
Hi Alex,
Unfortunately those messages didn't helped me. I have been stepping inside RTGrapher. I have a question: If I have already configured #minX and #maxX in my grapher to specific Numbers (as in my case). Why do you perform #datasetComputeMinAndMax in RTGrapher>>renderIn: ?
If I manually set RTAbstractData>>computeMinAndMaxForX
.. minX := self builder minX. maxX := self builder maxX. ...
then nothing is displayed.
Cheers,
Hernán
2017-07-13 16:44 GMT-03:00 Alexandre Bergel alexandre.bergel@me.com:
Consider the example:
g := RTGrapher new.
ds := RTData new. ds barShape. ds points: #(1 2 3 -2). ds maxX: 10. g add: ds.
g configureForBarCharts. g axisX numberOfLabels: 4; labelConversion: [ :value | value + 500 ].
g
Does this solve your problem?
Cheers, Alexandre
-- _,.;:~^~:;._,.;:~^~:;._,.;:~^~:;._,.;:~^~:;._,.;: Alexandre Bergel http://www.bergel.eu ^~:;._,.;:~^~:;._,.;:~^~:;._,.;:~^~:;._,.;:~^~:;.
On Jul 13, 2017, at 7:22 PM, Hernán Morales Durand < hernan.morales@gmail.com> wrote:
Hi Alex,
Thank you for taking care of this issue. The problem is partially fixed. I saw you implemented
configureForBarCharts
self datasets do: #offsetForBarCharts.
self minX: 0.5.
self maxX: self getMaxNumberOfPoints.
self axisX noTick.
However, I want to display the ticks, so I borrowed the first 3 lines for my plot method :
plotHistogramBins: binNumber xAxisLabel: axisXLabel yAxisLabel:
axixYLabel color: aColor barWidth: barWidth
| bins minPoint g ds |

bins := self groupedBySeqLengthDistribution: binNumber.
minPoint := ((bins reject: #isEmpty) detectMin: #size) anyOne size.

" Build diagram "
g := RTGrapher new
        extent: 500 @ 200;
        minX: minPoint;
        withoutOrigin;
        yourself.
ds := RTData new
    points: bins;
    x: [ : c | c ifEmpty: [ minPoint ] ifNotEmpty: [ : d | d anyOne
size ] ]; y: #size. ds barShape borderColor: Color black; color: aColor; width: barWidth. g add: ds.
" Configure axis settings "
g axisY
    title: axixYLabel;
    color: Color black;
    noDecimal.
g axisX
    noDecimal;
    fromPoint: minPoint;
    color: Color black;
    title: axisXLabel.

g datasets do: #offsetForBarCharts.
g minX: 0.
g maxX: g getMaxNumberOfPoints.

" Open visualization in a new window "
g open.
Now the shift problem is fixed, but I lost the sequence lengths in the X axis. Please see the two attached screenshots.
Cheers,
Hernán
2017-07-09 5:20 GMT-03:00 Alexandre Bergel alexandre.bergel@me.com: Hi Hernán,
Sorry to reply to late.
Can you update Roassal and try:
-=-=-=-=-=-=-=-=-= g := RTGrapher new.
ds := RTData new. ds barShape. ds points: #(1 2 3 -2). ds maxX: 10. g add: ds.
g configureForBarCharts.
g
The call configureforBarCharts should do what you expect.
Cheers, Alexandre <Screenshot 2017-07-09 10.20.26.png>
-- _,.;:~^~:;._,.;:~^~:;._,.;:~^~:;._,.;:~^~:;._,.;: Alexandre Bergel http://www.bergel.eu ^~:;._,.;:~^~:;._,.;:~^~:;._,.;:~^~:;._,.;:~^~:;.
On Jun 16, 2017, at 4:35 PM, Hernán Morales Durand < hernan.morales@gmail.com> wrote:
Hi Alex
I attached another screenshot which describes exactly the problem.
2017-06-16 10:40 GMT-03:00 Alexandre Bergel alexandre.bergel@me.com: Hi Hernán,
I am not sure what exactly is the problematic situation you describe. Why you cannot simply with with #minX: and #maxX: ?
My script actually sets minX: but it is wrongly drawn in the histogram
For example, I tried to reuse the code you have provided. I can have:
bins := #(#(1 1 1 1 ) #(2 2 2) #(5 5 5 5 5)).
minPoint := ((bins reject: #isEmpty) detectMin: [ : c | c size ])
anyOne.
" Build diagram "
g := RTGrapher new
        extent: 500 @ 200;
        minX: 0;
maxX: 6; withoutOrigin; yourself. ds := RTData new points: bins; x: [ : c | c ifEmpty: [ minPoint ] ifNotEmpty: [ : d | d anyOne ] ]; y: #size. ds barShape borderColor: Color black; color: Color red trans; width: 30. g add: ds.
g<Screenshot 2017-06-16 09.39.25.png>
But you can have "minX: 1", which in that case, the first bar is above the Y-Axis. This is what one would expect.
The problem is not positioning the bars above the Y-Axis, but positioning them in the X-Axis.
Which rendering do you wish to have? Can you provide a self-contained piece of code that I can run on my machine?
If you have some time you could install BioSmalltalk in Pharo 5 (I haven't tested Pharo 6 yet) and evaluate the problematic expression: Metacello new smalltalkhubUser: 'hernan' project: 'BioSmalltalk'; configuration: 'BioSmalltalk'; version: #bleedingEdge; load
(BioParser parseMultiFastaFile: BioObject testFilesDirectoryName asFileReference / 'ls_orchid.fasta') plotHistogramBins: 20 xAxisLabel: 'Sequence lengths (bp)' yAxisLabel: 'Count' color: Color red
Cheers,
Hernán
Cheers, Alexandre -- _,.;:~^~:;._,.;:~^~:;._,.;:~^~:;._,.;:~^~:;._,.;: Alexandre Bergel http://www.bergel.eu ^~:;._,.;:~^~:;._,.;:~^~:;._,.;:~^~:;._,.;:~^~:;.
On Jun 15, 2017, at 1:16 AM, Hernán Morales Durand < hernan.morales@gmail.com> wrote:
Hi guys,
I am experiencing a problem visualizing histograms in Roassal with Pharo 5. In the attached image you can observe the first bar shape starts from a negative X axis value, where I want to start from 0. Besides, some bars are gapped but I don't know why.
I am using with the following code:
| bins minPoint g ds |

bins := self groupedBySeqLengthDistribution: binNumber.
minPoint := ((bins reject: #isEmpty) detectMin: [ : c | c size ])
anyOne size.
" Build diagram "
g := RTGrapher new
        extent: 500 @ 200;
        minX: minPoint;
        withoutOrigin;
        yourself.
ds := RTData new
    points: bins;
    x: [ : c | c ifEmpty: [ minPoint ] ifNotEmpty: [ : d | d anyOne
size ] ]; y: #size. ds barShape borderColor: Color black; color: aColor; width: barWidth. g add: ds.
" Configure axis settings "
g axisY
    title: axixYLabel;
    color: Color black;
    noDecimal.
g axisX
    noDecimal;
    fromPoint: minPoint;
    color: Color black;
    title: axisXLabel.
" Open visualization in a new window "
g open.
Any idea what I am missing?
Cheers,
Hernán <Roassal.jpeg>_______________________________________________ Moose-dev mailing list Moose-dev@list.inf.unibe.ch https://www.list.inf.unibe.ch/listinfo/moose-dev
Moose-dev mailing list Moose-dev@list.inf.unibe.ch https://www.list.inf.unibe.ch/listinfo/moose-dev
<unnamed.jpg>_______________________________________________ Moose-dev mailing list Moose-dev@list.inf.unibe.ch https://www.list.inf.unibe.ch/listinfo/moose-dev
Moose-dev mailing list Moose-dev@list.inf.unibe.ch https://www.list.inf.unibe.ch/listinfo/moose-dev
<Grapher1.jpg><Grapher2.jpg>________________________________ _______________ Moose-dev mailing list Moose-dev@list.inf.unibe.ch https://www.list.inf.unibe.ch/listinfo/moose-dev
Moose-dev mailing list Moose-dev@list.inf.unibe.ch https://www.list.inf.unibe.ch/listinfo/moose-dev
I have a question: If I have already configured #minX and #maxX in my grapher to specific Numbers (as in my case). Why do you perform #datasetComputeMinAndMax in RTGrapher>>renderIn: ?
Because you could have different data sets with different min and max values. These data sets have to be homogenized to fit within one graph.
If I manually set RTAbstractData>>computeMinAndMaxForX
..
minX := self builder minX.
maxX := self builder maxX.
...
then nothing is displayed.
Can you provide a simple examples that I can reproduce on my computer ? :-)
Cheers, Alexandre
2017-07-13 16:44 GMT-03:00 Alexandre Bergel <alexandre.bergel@me.com mailto:alexandre.bergel@me.com>: Consider the example: -=-=-=-=-=-=-=-=-= g := RTGrapher new.
ds := RTData new. ds barShape. ds points: #(1 2 3 -2). ds maxX: 10. g add: ds.
g configureForBarCharts. g axisX numberOfLabels: 4; labelConversion: [ :value | value + 500 ].
g
<Screenshot 2017-07-13 21.44.20.png>
Does this solve your problem?
Cheers, Alexandre
-- _,.;:~^~:;._,.;:~^~:;._,.;:~^~:;._,.;:~^~:;._,.;: Alexandre Bergel http://www.bergel.eu http://www.bergel.eu/ ^~:;._,.;:~^~:;._,.;:~^~:;._,.;:~^~:;._,.;:~^~:;.
On Jul 13, 2017, at 7:22 PM, Hernán Morales Durand <hernan.morales@gmail.com mailto:hernan.morales@gmail.com> wrote:
Hi Alex,
Thank you for taking care of this issue. The problem is partially fixed. I saw you implemented
configureForBarCharts
self datasets do: #offsetForBarCharts.
self minX: 0.5.
self maxX: self getMaxNumberOfPoints.
self axisX noTick.
However, I want to display the ticks, so I borrowed the first 3 lines for my plot method :
plotHistogramBins: binNumber xAxisLabel: axisXLabel yAxisLabel: axixYLabel color: aColor barWidth: barWidth
| bins minPoint g ds |

bins := self groupedBySeqLengthDistribution: binNumber.
minPoint := ((bins reject: #isEmpty) detectMin: #size) anyOne size.

" Build diagram "
g := RTGrapher new
        extent: 500 @ 200;
        minX: minPoint;
        withoutOrigin;
        yourself.
ds := RTData new
    points: bins;
    x: [ : c | c ifEmpty: [ minPoint ] ifNotEmpty: [ : d | d anyOne size ] ];
    y: #size.
ds barShape
    borderColor: Color black;
    color: aColor;
    width: barWidth.
g add: ds.

" Configure axis settings "
g axisY
    title: axixYLabel;
    color: Color black;
    noDecimal.
g axisX
    noDecimal;
    fromPoint: minPoint;
    color: Color black;
    title: axisXLabel.

g datasets do: #offsetForBarCharts.
g minX: 0.
g maxX: g getMaxNumberOfPoints.

" Open visualization in a new window "
g open.
Now the shift problem is fixed, but I lost the sequence lengths in the X axis. Please see the two attached screenshots.
Cheers,
Hernán
2017-07-09 5:20 GMT-03:00 Alexandre Bergel <alexandre.bergel@me.com mailto:alexandre.bergel@me.com>: Hi Hernán,
Sorry to reply to late.
Can you update Roassal and try:
-=-=-=-=-=-=-=-=-= g := RTGrapher new.
ds := RTData new. ds barShape. ds points: #(1 2 3 -2). ds maxX: 10. g add: ds.
g configureForBarCharts.
g
The call configureforBarCharts should do what you expect.
Cheers, Alexandre <Screenshot 2017-07-09 10.20.26.png>
-- _,.;:~^~:;._,.;:~^~:;._,.;:~^~:;._,.;:~^~:;._,.;: Alexandre Bergel http://www.bergel.eu http://www.bergel.eu/ ^~:;._,.;:~^~:;._,.;:~^~:;._,.;:~^~:;._,.;:~^~:;.
On Jun 16, 2017, at 4:35 PM, Hernán Morales Durand <hernan.morales@gmail.com mailto:hernan.morales@gmail.com> wrote:
Hi Alex
I attached another screenshot which describes exactly the problem.
2017-06-16 10:40 GMT-03:00 Alexandre Bergel <alexandre.bergel@me.com mailto:alexandre.bergel@me.com>: Hi Hernán,
I am not sure what exactly is the problematic situation you describe. Why you cannot simply with with #minX: and #maxX: ?
My script actually sets minX: but it is wrongly drawn in the histogram
For example, I tried to reuse the code you have provided. I can have:
bins := #(#(1 1 1 1 ) #(2 2 2) #(5 5 5 5 5)).
minPoint := ((bins reject: #isEmpty) detectMin: [ : c | c size ]) anyOne.

" Build diagram "
g := RTGrapher new
        extent: 500 @ 200;
        minX: 0;
		maxX: 6;
        withoutOrigin;
        yourself.
ds := RTData new
    points: bins;
    x: [ : c | c ifEmpty: [ minPoint ] ifNotEmpty: [ : d | d anyOne ] ];
    y: #size.
ds barShape
    borderColor: Color black;
    color: Color red trans;
	width: 30.
g add: ds.

g
<Screenshot 2017-06-16 09.39.25.png>
But you can have "minX: 1", which in that case, the first bar is above the Y-Axis. This is what one would expect.
The problem is not positioning the bars above the Y-Axis, but positioning them in the X-Axis.
Which rendering do you wish to have? Can you provide a self-contained piece of code that I can run on my machine?
If you have some time you could install BioSmalltalk in Pharo 5 (I haven't tested Pharo 6 yet) and evaluate the problematic expression: Metacello new smalltalkhubUser: 'hernan' project: 'BioSmalltalk'; configuration: 'BioSmalltalk'; version: #bleedingEdge; load
(BioParser parseMultiFastaFile: BioObject testFilesDirectoryName asFileReference / 'ls_orchid.fasta') plotHistogramBins: 20 xAxisLabel: 'Sequence lengths (bp)' yAxisLabel: 'Count' color: Color red
Cheers,
Hernán
Cheers, Alexandre -- _,.;:~^~:;._,.;:~^~:;._,.;:~^~:;._,.;:~^~:;._,.;: Alexandre Bergel http://www.bergel.eu http://www.bergel.eu/ ^~:;._,.;:~^~:;._,.;:~^~:;._,.;:~^~:;._,.;:~^~:;.
On Jun 15, 2017, at 1:16 AM, Hernán Morales Durand <hernan.morales@gmail.com mailto:hernan.morales@gmail.com> wrote:
Hi guys,
I am experiencing a problem visualizing histograms in Roassal with Pharo 5. In the attached image you can observe the first bar shape starts from a negative X axis value, where I want to start from 0. Besides, some bars are gapped but I don't know why.
I am using with the following code:
| bins minPoint g ds |

bins := self groupedBySeqLengthDistribution: binNumber.
minPoint := ((bins reject: #isEmpty) detectMin: [ : c | c size ]) anyOne size.

" Build diagram "
g := RTGrapher new
        extent: 500 @ 200;
        minX: minPoint;
        withoutOrigin;
        yourself.
ds := RTData new
    points: bins;
    x: [ : c | c ifEmpty: [ minPoint ] ifNotEmpty: [ : d | d anyOne size ] ];
    y: #size.
ds barShape
    borderColor: Color black;
    color: aColor;
    width: barWidth.
g add: ds.

" Configure axis settings "
g axisY
    title: axixYLabel;
    color: Color black;
    noDecimal.
g axisX
    noDecimal;
    fromPoint: minPoint;
    color: Color black;
    title: axisXLabel.
" Open visualization in a new window "
g open.
Any idea what I am missing?
Cheers,
Hernán <Roassal.jpeg>_______________________________________________ Moose-dev mailing list Moose-dev@list.inf.unibe.ch mailto:Moose-dev@list.inf.unibe.ch https://www.list.inf.unibe.ch/listinfo/moose-dev https://www.list.inf.unibe.ch/listinfo/moose-dev
Moose-dev mailing list Moose-dev@list.inf.unibe.ch mailto:Moose-dev@list.inf.unibe.ch https://www.list.inf.unibe.ch/listinfo/moose-dev https://www.list.inf.unibe.ch/listinfo/moose-dev
<unnamed.jpg>_______________________________________________ Moose-dev mailing list Moose-dev@list.inf.unibe.ch mailto:Moose-dev@list.inf.unibe.ch https://www.list.inf.unibe.ch/listinfo/moose-dev https://www.list.inf.unibe.ch/listinfo/moose-dev
Moose-dev mailing list Moose-dev@list.inf.unibe.ch mailto:Moose-dev@list.inf.unibe.ch https://www.list.inf.unibe.ch/listinfo/moose-dev https://www.list.inf.unibe.ch/listinfo/moose-dev
<Grapher1.jpg><Grapher2.jpg>_______________________________________________ Moose-dev mailing list Moose-dev@list.inf.unibe.ch mailto:Moose-dev@list.inf.unibe.ch https://www.list.inf.unibe.ch/listinfo/moose-dev https://www.list.inf.unibe.ch/listinfo/moose-dev
Moose-dev mailing list Moose-dev@list.inf.unibe.ch mailto:Moose-dev@list.inf.unibe.ch https://www.list.inf.unibe.ch/listinfo/moose-dev https://www.list.inf.unibe.ch/listinfo/moose-dev
Moose-dev mailing list Moose-dev@list.inf.unibe.ch https://www.list.inf.unibe.ch/listinfo/moose-dev
Hi Alex,
2017-07-21 15:47 GMT-03:00 Alexandre Bergel alexandre.bergel@me.com:
I have a question: If I have already configured #minX and #maxX in my grapher to specific Numbers (as in my case). Why do you perform #datasetComputeMinAndMax in RTGrapher>>renderIn: ?
Because you could have different data sets with different min and max values. These data sets have to be homogenized to fit within one graph.
I don't want to criticize the design decisions behind Roassal, my goal is to have this histogram rendered as I have seen in other libraries. I understand that you have modeled a generic class (RTGrapher) which could handle 1..n data sets and that sounds reasonable. In the case of having >= 2 data sets, adjusting the min and max is not only desirable but necessary because as you said, they possibly don't fit.
But in the case of having just one data set, and I specifically configured the min and max, could you trust my min and max values by not adjusting by #datasetComputeMinAndMax ? Maybe we could get faster rendering times as a plus?
Does it makes sense?
If I manually set RTAbstractData>>computeMinAndMaxForX
..
minX := self builder minX.
maxX := self builder maxX.
...
then nothing is displayed.
Can you provide a simple examples that I can reproduce on my computer ? :-)
I prepared a BioSmalltalk image with the script ready to be evaluated:
https://www.dropbox.com/s/v1un45w15xypnbj/BioSmalltalk_image.zip?dl=0
Let me know any issue. Cheers,
Hernán
Cheers, Alexandre
2017-07-13 16:44 GMT-03:00 Alexandre Bergel alexandre.bergel@me.com:
Consider the example:
g := RTGrapher new.
ds := RTData new. ds barShape. ds points: #(1 2 3 -2). ds maxX: 10. g add: ds.
g configureForBarCharts. g axisX numberOfLabels: 4; labelConversion: [ :value | value + 500 ].
g
<Screenshot 2017-07-13 21.44.20.png>
Does this solve your problem?
Cheers, Alexandre
-- _,.;:~^~:;._,.;:~^~:;._,.;:~^~:;._,.;:~^~:;._,.;: Alexandre Bergel http://www.bergel.eu ^~:;._,.;:~^~:;._,.;:~^~:;._,.;:~^~:;._,.;:~^~:;.
On Jul 13, 2017, at 7:22 PM, Hernán Morales Durand hernan.morales@gmail.com wrote:
Hi Alex,
Thank you for taking care of this issue. The problem is partially fixed. I saw you implemented
configureForBarCharts
self datasets do: #offsetForBarCharts.
self minX: 0.5.
self maxX: self getMaxNumberOfPoints.
self axisX noTick.
However, I want to display the ticks, so I borrowed the first 3 lines for my plot method :
plotHistogramBins: binNumber xAxisLabel: axisXLabel yAxisLabel: axixYLabel color: aColor barWidth: barWidth
| bins minPoint g ds |

bins := self groupedBySeqLengthDistribution: binNumber.
minPoint := ((bins reject: #isEmpty) detectMin: #size) anyOne size.

" Build diagram "
g := RTGrapher new
        extent: 500 @ 200;
        minX: minPoint;
        withoutOrigin;
        yourself.
ds := RTData new
    points: bins;
    x: [ : c | c ifEmpty: [ minPoint ] ifNotEmpty: [ : d | d anyOne
size ] ]; y: #size. ds barShape borderColor: Color black; color: aColor; width: barWidth. g add: ds.
" Configure axis settings "
g axisY
    title: axixYLabel;
    color: Color black;
    noDecimal.
g axisX
    noDecimal;
    fromPoint: minPoint;
    color: Color black;
    title: axisXLabel.

g datasets do: #offsetForBarCharts.
g minX: 0.
g maxX: g getMaxNumberOfPoints.

" Open visualization in a new window "
g open.
Now the shift problem is fixed, but I lost the sequence lengths in the X axis. Please see the two attached screenshots.
Cheers,
Hernán
2017-07-09 5:20 GMT-03:00 Alexandre Bergel alexandre.bergel@me.com: Hi Hernán,
Sorry to reply to late.
Can you update Roassal and try:
-=-=-=-=-=-=-=-=-= g := RTGrapher new.
ds := RTData new. ds barShape. ds points: #(1 2 3 -2). ds maxX: 10. g add: ds.
g configureForBarCharts.
g
The call configureforBarCharts should do what you expect.
Cheers, Alexandre <Screenshot 2017-07-09 10.20.26.png>
-- _,.;:~^~:;._,.;:~^~:;._,.;:~^~:;._,.;:~^~:;._,.;: Alexandre Bergel http://www.bergel.eu ^~:;._,.;:~^~:;._,.;:~^~:;._,.;:~^~:;._,.;:~^~:;.
On Jun 16, 2017, at 4:35 PM, Hernán Morales Durand hernan.morales@gmail.com wrote:
Hi Alex
I attached another screenshot which describes exactly the problem.
2017-06-16 10:40 GMT-03:00 Alexandre Bergel alexandre.bergel@me.com: Hi Hernán,
I am not sure what exactly is the problematic situation you describe. Why you cannot simply with with #minX: and #maxX: ?
My script actually sets minX: but it is wrongly drawn in the histogram
For example, I tried to reuse the code you have provided. I can have:
bins := #(#(1 1 1 1 ) #(2 2 2) #(5 5 5 5 5)).
minPoint := ((bins reject: #isEmpty) detectMin: [ : c | c size ])
anyOne.
" Build diagram "
g := RTGrapher new
        extent: 500 @ 200;
        minX: 0;
maxX: 6; withoutOrigin; yourself. ds := RTData new points: bins; x: [ : c | c ifEmpty: [ minPoint ] ifNotEmpty: [ : d | d anyOne ] ]; y: #size. ds barShape borderColor: Color black; color: Color red trans; width: 30. g add: ds.
g<Screenshot 2017-06-16 09.39.25.png>
But you can have "minX: 1", which in that case, the first bar is above the Y-Axis. This is what one would expect.
The problem is not positioning the bars above the Y-Axis, but positioning them in the X-Axis.
Which rendering do you wish to have? Can you provide a self-contained piece of code that I can run on my machine?
If you have some time you could install BioSmalltalk in Pharo 5 (I haven't tested Pharo 6 yet) and evaluate the problematic expression: Metacello new smalltalkhubUser: 'hernan' project: 'BioSmalltalk'; configuration: 'BioSmalltalk'; version: #bleedingEdge; load
(BioParser parseMultiFastaFile: BioObject testFilesDirectoryName asFileReference / 'ls_orchid.fasta') plotHistogramBins: 20 xAxisLabel: 'Sequence lengths (bp)' yAxisLabel: 'Count' color: Color red
Cheers,
Hernán
Cheers, Alexandre -- _,.;:~^~:;._,.;:~^~:;._,.;:~^~:;._,.;:~^~:;._,.;: Alexandre Bergel http://www.bergel.eu ^~:;._,.;:~^~:;._,.;:~^~:;._,.;:~^~:;._,.;:~^~:;.
On Jun 15, 2017, at 1:16 AM, Hernán Morales Durand hernan.morales@gmail.com wrote:
Hi guys,
I am experiencing a problem visualizing histograms in Roassal with Pharo 5. In the attached image you can observe the first bar shape starts from a negative X axis value, where I want to start from 0. Besides, some bars are gapped but I don't know why.
I am using with the following code:
| bins minPoint g ds |

bins := self groupedBySeqLengthDistribution: binNumber.
minPoint := ((bins reject: #isEmpty) detectMin: [ : c | c size ])
anyOne size.
" Build diagram "
g := RTGrapher new
        extent: 500 @ 200;
        minX: minPoint;
        withoutOrigin;
        yourself.
ds := RTData new
    points: bins;
    x: [ : c | c ifEmpty: [ minPoint ] ifNotEmpty: [ : d | d anyOne
size ] ]; y: #size. ds barShape borderColor: Color black; color: aColor; width: barWidth. g add: ds.
" Configure axis settings "
g axisY
    title: axixYLabel;
    color: Color black;
    noDecimal.
g axisX
    noDecimal;
    fromPoint: minPoint;
    color: Color black;
    title: axisXLabel.
" Open visualization in a new window "
g open.
Any idea what I am missing?
Cheers,
Hernán <Roassal.jpeg>_______________________________________________ Moose-dev mailing list Moose-dev@list.inf.unibe.ch https://www.list.inf.unibe.ch/listinfo/moose-dev
Moose-dev mailing list Moose-dev@list.inf.unibe.ch https://www.list.inf.unibe.ch/listinfo/moose-dev
<unnamed.jpg>_______________________________________________ Moose-dev mailing list Moose-dev@list.inf.unibe.ch https://www.list.inf.unibe.ch/listinfo/moose-dev
Moose-dev mailing list Moose-dev@list.inf.unibe.ch https://www.list.inf.unibe.ch/listinfo/moose-dev
<Grapher1.jpg><Grapher2.jpg>_______________________________________________ Moose-dev mailing list Moose-dev@list.inf.unibe.ch https://www.list.inf.unibe.ch/listinfo/moose-dev
Moose-dev mailing list Moose-dev@list.inf.unibe.ch https://www.list.inf.unibe.ch/listinfo/moose-dev
Moose-dev mailing list Moose-dev@list.inf.unibe.ch https://www.list.inf.unibe.ch/listinfo/moose-dev
Moose-dev mailing list Moose-dev@list.inf.unibe.ch https://www.list.inf.unibe.ch/listinfo/moose-dev
Hi Hernán,
I understand your point. I am still figuring out what exactly the problem you are facing. I cannot open the image you provide. Which VM do you need for it? Which version of pharo are you using? I tried different VMs, including Cog from April 2013.
Alexandre
On Jul 26, 2017, at 1:35 AM, Hernán Morales Durand hernan.morales@gmail.com wrote:
Hi Alex,
2017-07-21 15:47 GMT-03:00 Alexandre Bergel alexandre.bergel@me.com:
I have a question: If I have already configured #minX and #maxX in my grapher to specific Numbers (as in my case). Why do you perform #datasetComputeMinAndMax in RTGrapher>>renderIn: ?
Because you could have different data sets with different min and max values. These data sets have to be homogenized to fit within one graph.
I don't want to criticize the design decisions behind Roassal, my goal is to have this histogram rendered as I have seen in other libraries. I understand that you have modeled a generic class (RTGrapher) which could handle 1..n data sets and that sounds reasonable. In the case of having >= 2 data sets, adjusting the min and max is not only desirable but necessary because as you said, they possibly don't fit.
But in the case of having just one data set, and I specifically configured the min and max, could you trust my min and max values by not adjusting by #datasetComputeMinAndMax ? Maybe we could get faster rendering times as a plus?
Does it makes sense?
If I manually set RTAbstractData>>computeMinAndMaxForX
.. minX := self builder minX. maxX := self builder maxX. ...
then nothing is displayed.
Can you provide a simple examples that I can reproduce on my computer ? :-)
I prepared a BioSmalltalk image with the script ready to be evaluated:
https://www.dropbox.com/s/v1un45w15xypnbj/BioSmalltalk_image.zip?dl=0
Let me know any issue. Cheers,
Hernán
Cheers, Alexandre
2017-07-13 16:44 GMT-03:00 Alexandre Bergel alexandre.bergel@me.com:
Consider the example:
g := RTGrapher new.
ds := RTData new. ds barShape. ds points: #(1 2 3 -2). ds maxX: 10. g add: ds.
g configureForBarCharts. g axisX numberOfLabels: 4; labelConversion: [ :value | value + 500 ].
g
<Screenshot 2017-07-13 21.44.20.png>
Does this solve your problem?
Cheers, Alexandre
-- _,.;:~^~:;._,.;:~^~:;._,.;:~^~:;._,.;:~^~:;._,.;: Alexandre Bergel http://www.bergel.eu ^~:;._,.;:~^~:;._,.;:~^~:;._,.;:~^~:;._,.;:~^~:;.
On Jul 13, 2017, at 7:22 PM, Hernán Morales Durand hernan.morales@gmail.com wrote:
Hi Alex,
Thank you for taking care of this issue. The problem is partially fixed. I saw you implemented
configureForBarCharts
self datasets do: #offsetForBarCharts. self minX: 0.5. self maxX: self getMaxNumberOfPoints. self axisX noTick.
However, I want to display the ticks, so I borrowed the first 3 lines for my plot method :
plotHistogramBins: binNumber xAxisLabel: axisXLabel yAxisLabel: axixYLabel color: aColor barWidth: barWidth
| bins minPoint g ds |
bins := self groupedBySeqLengthDistribution: binNumber. minPoint := ((bins reject: #isEmpty) detectMin: #size) anyOne size.
" Build diagram " g := RTGrapher new extent: 500 @ 200; minX: minPoint; withoutOrigin; yourself. ds := RTData new points: bins; x: [ : c | c ifEmpty: [ minPoint ] ifNotEmpty: [ : d | d anyOne size ] ]; y: #size. ds barShape borderColor: Color black; color: aColor; width: barWidth. g add: ds.
" Configure axis settings " g axisY title: axixYLabel; color: Color black; noDecimal. g axisX noDecimal; fromPoint: minPoint; color: Color black; title: axisXLabel.
g datasets do: #offsetForBarCharts. g minX: 0. g maxX: g getMaxNumberOfPoints.
" Open visualization in a new window " g open.
Now the shift problem is fixed, but I lost the sequence lengths in the X axis. Please see the two attached screenshots.
Cheers,
Hernán
2017-07-09 5:20 GMT-03:00 Alexandre Bergel alexandre.bergel@me.com: Hi Hernán,
Sorry to reply to late.
Can you update Roassal and try:
-=-=-=-=-=-=-=-=-= g := RTGrapher new.
ds := RTData new. ds barShape. ds points: #(1 2 3 -2). ds maxX: 10. g add: ds.
g configureForBarCharts.
g
The call configureforBarCharts should do what you expect.
Cheers, Alexandre <Screenshot 2017-07-09 10.20.26.png>
-- _,.;:~^~:;._,.;:~^~:;._,.;:~^~:;._,.;:~^~:;._,.;: Alexandre Bergel http://www.bergel.eu ^~:;._,.;:~^~:;._,.;:~^~:;._,.;:~^~:;._,.;:~^~:;.
On Jun 16, 2017, at 4:35 PM, Hernán Morales Durand hernan.morales@gmail.com wrote:
Hi Alex
I attached another screenshot which describes exactly the problem.
2017-06-16 10:40 GMT-03:00 Alexandre Bergel alexandre.bergel@me.com: Hi Hernán,
I am not sure what exactly is the problematic situation you describe. Why you cannot simply with with #minX: and #maxX: ?
My script actually sets minX: but it is wrongly drawn in the histogram
For example, I tried to reuse the code you have provided. I can have:
bins := #(#(1 1 1 1 ) #(2 2 2) #(5 5 5 5 5)). minPoint := ((bins reject: #isEmpty) detectMin: [ : c | c size ]) anyOne.
" Build diagram " g := RTGrapher new extent: 500 @ 200; minX: 0; maxX: 6; withoutOrigin; yourself. ds := RTData new points: bins; x: [ : c | c ifEmpty: [ minPoint ] ifNotEmpty: [ : d | d anyOne ] ]; y: #size. ds barShape borderColor: Color black; color: Color red trans; width: 30. g add: ds.
g <Screenshot 2017-06-16 09.39.25.png>
But you can have "minX: 1", which in that case, the first bar is above the Y-Axis. This is what one would expect.
The problem is not positioning the bars above the Y-Axis, but positioning them in the X-Axis.
Which rendering do you wish to have? Can you provide a self-contained piece of code that I can run on my machine?
If you have some time you could install BioSmalltalk in Pharo 5 (I haven't tested Pharo 6 yet) and evaluate the problematic expression: Metacello new smalltalkhubUser: 'hernan' project: 'BioSmalltalk'; configuration: 'BioSmalltalk'; version: #bleedingEdge; load
(BioParser parseMultiFastaFile: BioObject testFilesDirectoryName asFileReference / 'ls_orchid.fasta') plotHistogramBins: 20 xAxisLabel: 'Sequence lengths (bp)' yAxisLabel: 'Count' color: Color red
Cheers,
Hernán
Cheers, Alexandre -- _,.;:~^~:;._,.;:~^~:;._,.;:~^~:;._,.;:~^~:;._,.;: Alexandre Bergel http://www.bergel.eu ^~:;._,.;:~^~:;._,.;:~^~:;._,.;:~^~:;._,.;:~^~:;.
On Jun 15, 2017, at 1:16 AM, Hernán Morales Durand hernan.morales@gmail.com wrote:
Hi guys,
I am experiencing a problem visualizing histograms in Roassal with Pharo 5. In the attached image you can observe the first bar shape starts from a negative X axis value, where I want to start from 0. Besides, some bars are gapped but I don't know why.
I am using with the following code:
| bins minPoint g ds |

bins := self groupedBySeqLengthDistribution: binNumber.
minPoint := ((bins reject: #isEmpty) detectMin: [ : c | c size ])
anyOne size.
" Build diagram "
g := RTGrapher new
        extent: 500 @ 200;
        minX: minPoint;
        withoutOrigin;
        yourself.
ds := RTData new
    points: bins;
    x: [ : c | c ifEmpty: [ minPoint ] ifNotEmpty: [ : d | d anyOne
size ] ]; y: #size. ds barShape borderColor: Color black; color: aColor; width: barWidth. g add: ds.
" Configure axis settings "
g axisY
    title: axixYLabel;
    color: Color black;
    noDecimal.
g axisX
    noDecimal;
    fromPoint: minPoint;
    color: Color black;
    title: axisXLabel.
" Open visualization in a new window "
g open.
Any idea what I am missing?
Cheers,
Hernán <Roassal.jpeg>_______________________________________________ Moose-dev mailing list Moose-dev@list.inf.unibe.ch https://www.list.inf.unibe.ch/listinfo/moose-dev
Moose-dev mailing list Moose-dev@list.inf.unibe.ch https://www.list.inf.unibe.ch/listinfo/moose-dev
<unnamed.jpg>_______________________________________________ Moose-dev mailing list Moose-dev@list.inf.unibe.ch https://www.list.inf.unibe.ch/listinfo/moose-dev
Moose-dev mailing list Moose-dev@list.inf.unibe.ch https://www.list.inf.unibe.ch/listinfo/moose-dev
<Grapher1.jpg><Grapher2.jpg>_______________________________________________ Moose-dev mailing list Moose-dev@list.inf.unibe.ch https://www.list.inf.unibe.ch/listinfo/moose-dev
Moose-dev mailing list Moose-dev@list.inf.unibe.ch https://www.list.inf.unibe.ch/listinfo/moose-dev
Moose-dev mailing list Moose-dev@list.inf.unibe.ch https://www.list.inf.unibe.ch/listinfo/moose-dev
Moose-dev mailing list Moose-dev@list.inf.unibe.ch https://www.list.inf.unibe.ch/listinfo/moose-dev
Moose-dev mailing list Moose-dev@list.inf.unibe.ch https://www.list.inf.unibe.ch/listinfo/moose-dev
Hi Alex,
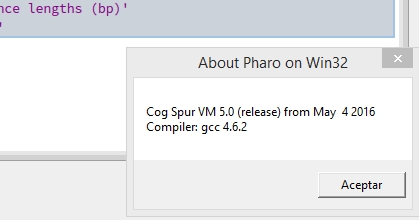
I forgot to mention, it is a Pharo 5.0 standard image saved in Win 8.1, Cog Spur VM 5.0 (release) from May 4, 2016 Compiler gcc 4.6.2, downloaded using
wget -O- get.pharo.org/50+vm | bash -
Anyway, I launched my hackintosh OS X Mavericks and could open the image after changing the permissions
chmod 644 Pharo.image Pharo.changes ../MacOS/Pharo Pharo.image
Do you get an error message?
Cheers,
Hernán
2017-07-26 20:27 GMT-03:00 Alexandre Bergel alexandre.bergel@me.com:
Hi Hernán,
I understand your point. I am still figuring out what exactly the problem you are facing. I cannot open the image you provide. Which VM do you need for it? Which version of pharo are you using? I tried different VMs, including Cog from April 2013.
Alexandre
On Jul 26, 2017, at 1:35 AM, Hernán Morales Durand hernan.morales@gmail.com wrote:
Hi Alex,
2017-07-21 15:47 GMT-03:00 Alexandre Bergel alexandre.bergel@me.com:
I have a question: If I have already configured #minX and #maxX in my grapher to specific Numbers (as in my case). Why do you perform #datasetComputeMinAndMax in RTGrapher>>renderIn: ?
Because you could have different data sets with different min and max values. These data sets have to be homogenized to fit within one graph.
I don't want to criticize the design decisions behind Roassal, my goal is to have this histogram rendered as I have seen in other libraries. I understand that you have modeled a generic class (RTGrapher) which could handle 1..n data sets and that sounds reasonable. In the case of having >= 2 data sets, adjusting the min and max is not only desirable but necessary because as you said, they possibly don't fit.
But in the case of having just one data set, and I specifically configured the min and max, could you trust my min and max values by not adjusting by #datasetComputeMinAndMax ? Maybe we could get faster rendering times as a plus?
Does it makes sense?
If I manually set RTAbstractData>>computeMinAndMaxForX
.. minX := self builder minX. maxX := self builder maxX. ...
then nothing is displayed.
Can you provide a simple examples that I can reproduce on my computer ? :-)
I prepared a BioSmalltalk image with the script ready to be evaluated:
https://www.dropbox.com/s/v1un45w15xypnbj/BioSmalltalk_image.zip?dl=0
Let me know any issue. Cheers,
Hernán
Cheers, Alexandre
2017-07-13 16:44 GMT-03:00 Alexandre Bergel alexandre.bergel@me.com:
Consider the example:
g := RTGrapher new.
ds := RTData new. ds barShape. ds points: #(1 2 3 -2). ds maxX: 10. g add: ds.
g configureForBarCharts. g axisX numberOfLabels: 4; labelConversion: [ :value | value + 500 ].
g
<Screenshot 2017-07-13 21.44.20.png>
Does this solve your problem?
Cheers, Alexandre
-- _,.;:~^~:;._,.;:~^~:;._,.;:~^~:;._,.;:~^~:;._,.;: Alexandre Bergel http://www.bergel.eu ^~:;._,.;:~^~:;._,.;:~^~:;._,.;:~^~:;._,.;:~^~:;.
On Jul 13, 2017, at 7:22 PM, Hernán Morales Durand hernan.morales@gmail.com wrote:
Hi Alex,
Thank you for taking care of this issue. The problem is partially fixed. I saw you implemented
configureForBarCharts
self datasets do: #offsetForBarCharts. self minX: 0.5. self maxX: self getMaxNumberOfPoints. self axisX noTick.
However, I want to display the ticks, so I borrowed the first 3 lines for my plot method :
plotHistogramBins: binNumber xAxisLabel: axisXLabel yAxisLabel: axixYLabel color: aColor barWidth: barWidth
| bins minPoint g ds |
bins := self groupedBySeqLengthDistribution: binNumber. minPoint := ((bins reject: #isEmpty) detectMin: #size) anyOne size.
" Build diagram " g := RTGrapher new extent: 500 @ 200; minX: minPoint; withoutOrigin; yourself. ds := RTData new points: bins; x: [ : c | c ifEmpty: [ minPoint ] ifNotEmpty: [ : d | d anyOne size ] ]; y: #size. ds barShape borderColor: Color black; color: aColor; width: barWidth. g add: ds.
" Configure axis settings " g axisY title: axixYLabel; color: Color black; noDecimal. g axisX noDecimal; fromPoint: minPoint; color: Color black; title: axisXLabel.
g datasets do: #offsetForBarCharts. g minX: 0. g maxX: g getMaxNumberOfPoints.
" Open visualization in a new window " g open.
Now the shift problem is fixed, but I lost the sequence lengths in the X axis. Please see the two attached screenshots.
Cheers,
Hernán
2017-07-09 5:20 GMT-03:00 Alexandre Bergel alexandre.bergel@me.com: Hi Hernán,
Sorry to reply to late.
Can you update Roassal and try:
-=-=-=-=-=-=-=-=-= g := RTGrapher new.
ds := RTData new. ds barShape. ds points: #(1 2 3 -2). ds maxX: 10. g add: ds.
g configureForBarCharts.
g
The call configureforBarCharts should do what you expect.
Cheers, Alexandre <Screenshot 2017-07-09 10.20.26.png>
-- _,.;:~^~:;._,.;:~^~:;._,.;:~^~:;._,.;:~^~:;._,.;: Alexandre Bergel http://www.bergel.eu ^~:;._,.;:~^~:;._,.;:~^~:;._,.;:~^~:;._,.;:~^~:;.
On Jun 16, 2017, at 4:35 PM, Hernán Morales Durand hernan.morales@gmail.com wrote:
Hi Alex
I attached another screenshot which describes exactly the problem.
2017-06-16 10:40 GMT-03:00 Alexandre Bergel alexandre.bergel@me.com: Hi Hernán,
I am not sure what exactly is the problematic situation you describe. Why you cannot simply with with #minX: and #maxX: ?
My script actually sets minX: but it is wrongly drawn in the histogram
For example, I tried to reuse the code you have provided. I can have:
bins := #(#(1 1 1 1 ) #(2 2 2) #(5 5 5 5 5)). minPoint := ((bins reject: #isEmpty) detectMin: [ : c | c size ]) anyOne.
" Build diagram " g := RTGrapher new extent: 500 @ 200; minX: 0; maxX: 6; withoutOrigin; yourself. ds := RTData new points: bins; x: [ : c | c ifEmpty: [ minPoint ] ifNotEmpty: [ : d | d anyOne ] ]; y: #size. ds barShape borderColor: Color black; color: Color red trans; width: 30. g add: ds.
g <Screenshot 2017-06-16 09.39.25.png>
But you can have "minX: 1", which in that case, the first bar is above the Y-Axis. This is what one would expect.
The problem is not positioning the bars above the Y-Axis, but positioning them in the X-Axis.
Which rendering do you wish to have? Can you provide a self-contained piece of code that I can run on my machine?
If you have some time you could install BioSmalltalk in Pharo 5 (I haven't tested Pharo 6 yet) and evaluate the problematic expression: Metacello new smalltalkhubUser: 'hernan' project: 'BioSmalltalk'; configuration: 'BioSmalltalk'; version: #bleedingEdge; load
(BioParser parseMultiFastaFile: BioObject testFilesDirectoryName asFileReference / 'ls_orchid.fasta') plotHistogramBins: 20 xAxisLabel: 'Sequence lengths (bp)' yAxisLabel: 'Count' color: Color red
Cheers,
Hernán
Cheers, Alexandre -- _,.;:~^~:;._,.;:~^~:;._,.;:~^~:;._,.;:~^~:;._,.;: Alexandre Bergel http://www.bergel.eu ^~:;._,.;:~^~:;._,.;:~^~:;._,.;:~^~:;._,.;:~^~:;.
On Jun 15, 2017, at 1:16 AM, Hernán Morales Durand hernan.morales@gmail.com wrote:
Hi guys,
I am experiencing a problem visualizing histograms in Roassal with Pharo 5. In the attached image you can observe the first bar shape starts from a negative X axis value, where I want to start from 0. Besides, some bars are gapped but I don't know why.
I am using with the following code:
| bins minPoint g ds |

bins := self groupedBySeqLengthDistribution: binNumber.
minPoint := ((bins reject: #isEmpty) detectMin: [ : c | c size ])
anyOne size.
" Build diagram "
g := RTGrapher new
        extent: 500 @ 200;
        minX: minPoint;
        withoutOrigin;
        yourself.
ds := RTData new
    points: bins;
    x: [ : c | c ifEmpty: [ minPoint ] ifNotEmpty: [ : d | d anyOne
size ] ]; y: #size. ds barShape borderColor: Color black; color: aColor; width: barWidth. g add: ds.
" Configure axis settings "
g axisY
    title: axixYLabel;
    color: Color black;
    noDecimal.
g axisX
    noDecimal;
    fromPoint: minPoint;
    color: Color black;
    title: axisXLabel.
" Open visualization in a new window "
g open.
Any idea what I am missing?
Cheers,
Hernán <Roassal.jpeg>_______________________________________________ Moose-dev mailing list Moose-dev@list.inf.unibe.ch https://www.list.inf.unibe.ch/listinfo/moose-dev
Moose-dev mailing list Moose-dev@list.inf.unibe.ch https://www.list.inf.unibe.ch/listinfo/moose-dev
<unnamed.jpg>_______________________________________________ Moose-dev mailing list Moose-dev@list.inf.unibe.ch https://www.list.inf.unibe.ch/listinfo/moose-dev
Moose-dev mailing list Moose-dev@list.inf.unibe.ch https://www.list.inf.unibe.ch/listinfo/moose-dev
<Grapher1.jpg><Grapher2.jpg>_______________________________________________ Moose-dev mailing list Moose-dev@list.inf.unibe.ch https://www.list.inf.unibe.ch/listinfo/moose-dev
Moose-dev mailing list Moose-dev@list.inf.unibe.ch https://www.list.inf.unibe.ch/listinfo/moose-dev
Moose-dev mailing list Moose-dev@list.inf.unibe.ch https://www.list.inf.unibe.ch/listinfo/moose-dev
Moose-dev mailing list Moose-dev@list.inf.unibe.ch https://www.list.inf.unibe.ch/listinfo/moose-dev
Moose-dev mailing list Moose-dev@list.inf.unibe.ch https://www.list.inf.unibe.ch/listinfo/moose-dev
-- _,.;:~^~:;._,.;:~^~:;._,.;:~^~:;._,.;:~^~:;._,.;: Alexandre Bergel http://www.bergel.eu ^~:;._,.;:~^~:;._,.;:~^~:;._,.;:~^~:;._,.;:~^~:;.
Moose-dev mailing list Moose-dev@list.inf.unibe.ch https://www.list.inf.unibe.ch/listinfo/moose-dev

Hi, I suspect your issue I want a bug per se. Your x axis starts at the first bar x location. The bars are going to be centered on the point - meaning it will overlap to the left (or negative) side.
As for the gaps I suspect that has to do with the data. The bars have a width and the space between each point is very small - so there will be overlap. And space for x values that aren't in your data (giving you the gaps).
Did you want instead each bar next to the next and individually labbeled?
On Jun 14, 2017 10:16 PM, "Hernán Morales Durand" hernan.morales@gmail.com wrote:
Hi guys,
I am experiencing a problem visualizing histograms in Roassal with Pharo 5. In the attached image you can observe the first bar shape starts from a negative X axis value, where I want to start from 0. Besides, some bars are gapped but I don't know why.
I am using with the following code:
| bins minPoint g ds | bins := self groupedBySeqLengthDistribution: binNumber. minPoint := ((bins reject: #isEmpty) detectMin: [ : c | c size ])anyOne size.
" Build diagram " g := RTGrapher new extent: 500 @ 200; minX: minPoint; withoutOrigin; yourself. ds := RTData new points: bins; x: [ : c | c ifEmpty: [ minPoint ] ifNotEmpty: [ : d | d anyOnesize ] ]; y: #size. ds barShape borderColor: Color black; color: aColor; width: barWidth. g add: ds.
" Configure axis settings " g axisY title: axixYLabel; color: Color black; noDecimal. g axisX noDecimal; fromPoint: minPoint; color: Color black; title: axisXLabel. " Open visualization in a new window " g open.Any idea what I am missing?
Cheers,
Hernán
Moose-dev mailing list Moose-dev@list.inf.unibe.ch https://www.list.inf.unibe.ch/listinfo/moose-dev
Hi Chris,
2017-06-16 14:06 GMT-03:00 Chris Cunningham cunningham.cb@gmail.com:
Hi, I suspect your issue I want a bug per se.
I didn't understood that.
Your x axis starts at the first bar x location. The bars are going to be centered on the point - meaning it will overlap to the left (or negative) side.
So my Axis X starts at 572. My minPoint is 592.
So why the first bar is shifted to the left?
Anyway, I had to manually substract to adjust the minPoint:
minPoint := ((bins reject: #isEmpty) detectMin: #size) anyOne size - 28.
As for the gaps I suspect that has to do with the data. The bars have a width and the space between each point is very small - so there will be overlap. And space for x values that aren't in your data (giving you the gaps).
Did you want instead each bar next to the next and individually labbeled?
I want each bar next to the next, I think I never saw a histogram with overlapped bars. Somehow matplotlib got this right:
http://biopython.org/DIST/docs/tutorial/Tutorial.html#htoc295
Cheers,
Hernán
On Jun 14, 2017 10:16 PM, "Hernán Morales Durand" hernan.morales@gmail.com
wrote:
Hi guys,
I am experiencing a problem visualizing histograms in Roassal with Pharo 5. In the attached image you can observe the first bar shape starts from a negative X axis value, where I want to start from 0. Besides, some bars are gapped but I don't know why.
I am using with the following code:
| bins minPoint g ds | bins := self groupedBySeqLengthDistribution: binNumber. minPoint := ((bins reject: #isEmpty) detectMin: [ : c | c size ])anyOne size.
" Build diagram " g := RTGrapher new extent: 500 @ 200; minX: minPoint; withoutOrigin; yourself. ds := RTData new points: bins; x: [ : c | c ifEmpty: [ minPoint ] ifNotEmpty: [ : d | d anyOnesize ] ]; y: #size. ds barShape borderColor: Color black; color: aColor; width: barWidth. g add: ds.
" Configure axis settings " g axisY title: axixYLabel; color: Color black; noDecimal. g axisX noDecimal; fromPoint: minPoint; color: Color black; title: axisXLabel. " Open visualization in a new window " g open.Any idea what I am missing?
Cheers,
Hernán
Moose-dev mailing list Moose-dev@list.inf.unibe.ch https://www.list.inf.unibe.ch/listinfo/moose-dev
Moose-dev mailing list Moose-dev@list.inf.unibe.ch https://www.list.inf.unibe.ch/listinfo/moose-dev
-
 Alexandre Bergel
 -
 Chris Cunningham
 -
 Hernán Morales Durand