
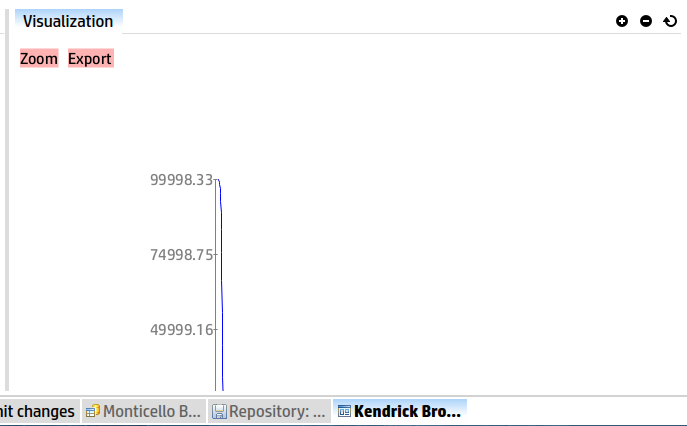
hi, i build a graph in glamour. But, when i run my browser, the graph not be at the center of the panel (like in the screen shot) and there are not the scroll bar for view properly. Also, i want to label the axis, how can i do it?
thanks!

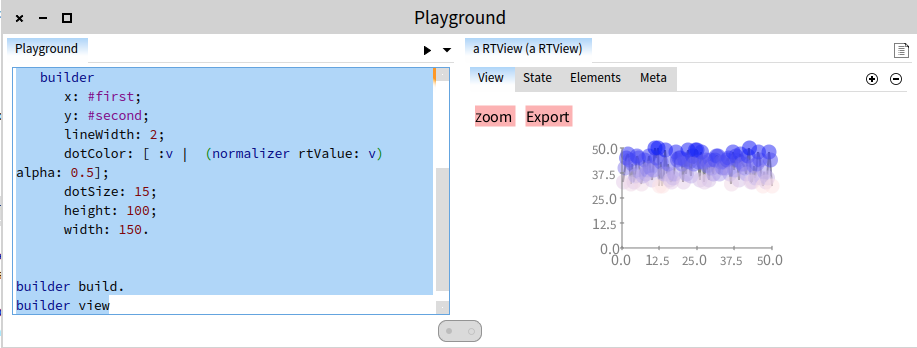
You can use #height: and #width: to a builder to set a particular size. Try this:
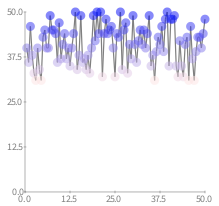
-=-=-=-=-=-=-=-=-=-=-=-=-=-=-= | builder normalizer data | data := (1 to: 100) collect: [ :i | Array with: i with: 20 atRandom + 30 ]. normalizer := RTNColorLinearNormalizer inContext: data withCommand: #second lowColor: Color paleRed highColor: Color blue. builder := GET2Line data: data. builder x: #first; y: #second; lineWidth: 2; dotColor: [ :v | (normalizer rtValue: v) alpha: 0.5]; dotSize: 15; height: 100; width: 150.
builder build. builder view -=-=-=-=-=-=-=-=-=-=-=-=-=-=-=
Without specifying height: and width: gives you something like:
-
 Alexandre Bergel
 -
 Fabrice Atrevi