
Hi,
I'm working with EyeSee to create some charts in Moose but unfortunately I haven't been able to create multiple lines in a single line chart, is this possible? and if so does anyone have some sample code to share?
Thanks.
Franco

Hi I don't have access to an image now to send you code but you can have a look into the class ESExamples. There are several examples there.
Regards, On May 3, 2012 12:59 AM, "Franco Sabadini" fsabadi@gmail.com wrote:
Hi,
I'm working with EyeSee to create some charts in Moose but unfortunately I haven't been able to create multiple lines in a single line chart, is this possible? and if so does anyone have some sample code to share?
Thanks.
Franco
Moose-dev mailing list Moose-dev@iam.unibe.ch https://www.iam.unibe.ch/mailman/listinfo/moose-dev
Hi,
You can do that using a compositeDiagram. Below you can check a simple example:
lineBarCompositeDiagram2 "self new lineBarCompositeDiagram2"
| diag1 diag2 diag3 compDiag model1 model2 model3 |
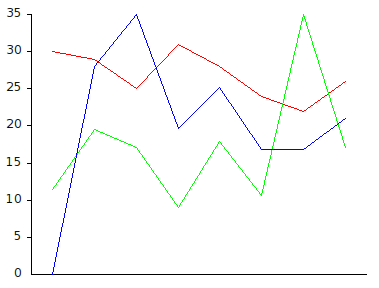
model1 := #(30 29 25 31 28 24 22 26). model2 := #(14 24 21 11 22 13 43 21). model3 := #(0 20 25 14 18 12 12 15).
diag1 := (ESDiagramRenderer new lineDiagram) y: #yourself; models: model1; regularAxis; defaultColor: Color red; yourself.
diag2 := (ESDiagramRenderer new lineDiagram) y: #yourself; defaultColor: Color green; models: model2; yourself.
diag3 := (ESDiagramRenderer new lineDiagram) y: #yourself; defaultColor: Color blue; models: model3; yourself.
compDiag := ESDiagramRenderer new. (compDiag compositeDiagram) add: diag1; add: diag2; add: diag3. ^ compDiag open
regards,
On Thu, May 3, 2012 at 10:36 AM, Andre Hora andrehoraa@gmail.com wrote:
Hi I don't have access to an image now to send you code but you can have a look into the class ESExamples. There are several examples there.
Regards, On May 3, 2012 12:59 AM, "Franco Sabadini" fsabadi@gmail.com wrote:
Hi,
I'm working with EyeSee to create some charts in Moose but unfortunately I haven't been able to create multiple lines in a single line chart, is this possible? and if so does anyone have some sample code to share?
Thanks.
Franco
Moose-dev mailing list Moose-dev@iam.unibe.ch https://www.iam.unibe.ch/mailman/listinfo/moose-dev

Andre,
Thank you so much for your help! We are gonna try with that...
Regards, Juan
On Tue, May 8, 2012 at 7:18 PM, Andre Hora andrehoraa@gmail.com wrote:
Hi,
You can do that using a compositeDiagram. Below you can check a simple example:
lineBarCompositeDiagram2 "self new lineBarCompositeDiagram2"
| diag1 diag2 diag3 compDiag model1 model2 model3 |

model1 := #(30 29 25 31 28 24 22 26).
model2 := #(14 24 21 11 22 13 43 21).
model3 := #(0 20 25 14 18 12 12 15).

diag1 := (ESDiagramRenderer new lineDiagram)
    y: #yourself;
    models: model1;
    regularAxis;
    defaultColor: Color red;
    yourself.

diag2 := (ESDiagramRenderer new lineDiagram)
    y: #yourself;
    defaultColor: Color green;
    models: model2;
    yourself.

diag3 := (ESDiagramRenderer new lineDiagram)
    y: #yourself;
    defaultColor: Color blue;
    models: model3;
    yourself.

compDiag := ESDiagramRenderer new.
(compDiag compositeDiagram)
    add: diag1;
    add: diag2;
    add: diag3.
^ compDiag open
regards,
On Thu, May 3, 2012 at 10:36 AM, Andre Hora andrehoraa@gmail.com wrote:
Hi I don't have access to an image now to send you code but you can have a look into the class ESExamples. There are several examples there.
Regards, On May 3, 2012 12:59 AM, "Franco Sabadini" fsabadi@gmail.com wrote:
Hi,
I'm working with EyeSee to create some charts in Moose but unfortunately I haven't been able to create multiple lines in a single line chart, is this possible? and if so does anyone have some sample code to share?
Thanks.
Franco
Moose-dev mailing list Moose-dev@iam.unibe.ch https://www.iam.unibe.ch/mailman/listinfo/moose-dev
-- Andre Hora
Moose-dev mailing list Moose-dev@iam.unibe.ch https://www.iam.unibe.ch/mailman/listinfo/moose-dev

Thanks for taking care of this, Andre.
Doru
On 9 May 2012, at 00:18, Andre Hora wrote:
Hi,
You can do that using a compositeDiagram. Below you can check a simple example:
lineBarCompositeDiagram2 "self new lineBarCompositeDiagram2"
| diag1 diag2 diag3 compDiag model1 model2 model3 | model1 := #(30 29 25 31 28 24 22 26). model2 := #(14 24 21 11 22 13 43 21). model3 := #(0 20 25 14 18 12 12 15). diag1 := (ESDiagramRenderer new lineDiagram) y: #yourself; models: model1; regularAxis; defaultColor: Color red; yourself. diag2 := (ESDiagramRenderer new lineDiagram) y: #yourself; defaultColor: Color green; models: model2; yourself. diag3 := (ESDiagramRenderer new lineDiagram) y: #yourself; defaultColor: Color blue; models: model3; yourself. compDiag := ESDiagramRenderer new. (compDiag compositeDiagram) add: diag1; add: diag2; add: diag3. ^ compDiag openregards,
On Thu, May 3, 2012 at 10:36 AM, Andre Hora andrehoraa@gmail.com wrote: Hi I don't have access to an image now to send you code but you can have a look into the class ESExamples. There are several examples there.
Regards,
On May 3, 2012 12:59 AM, "Franco Sabadini" fsabadi@gmail.com wrote: Hi,
I'm working with EyeSee to create some charts in Moose but unfortunately I haven't been able to create multiple lines in a single line chart, is this possible? and if so does anyone have some sample code to share?
Thanks.
Franco
Moose-dev mailing list Moose-dev@iam.unibe.ch https://www.iam.unibe.ch/mailman/listinfo/moose-dev
-- Andre Hora
<Screen shot 2012-05-09 at 12.19.40 AM.png>_______________________________________________ Moose-dev mailing list Moose-dev@iam.unibe.ch https://www.iam.unibe.ch/mailman/listinfo/moose-dev
-- www.tudorgirba.com
"There are no old things, there are only old ways of looking at them."

On Tue, May 8, 2012 at 3:18 PM, Andre Hora andrehoraa@gmail.com wrote:
Hi,
[cut]
model1 := #(30 29 25 31 28 24 22 26).
model2 := #(14 24 21 11 22 13 43 21).
model3 := #(0 20 25 14 18 12 12 15).
[cut]
diag2 := (ESDiagramRenderer new lineDiagram)
    y: #yourself;
    defaultColor: Color green;
    models: model2;
    yourself.

diag3 := (ESDiagramRenderer new lineDiagram)
    y: #yourself;
    defaultColor: Color blue;
    models: model3;
    yourself.
[snip]
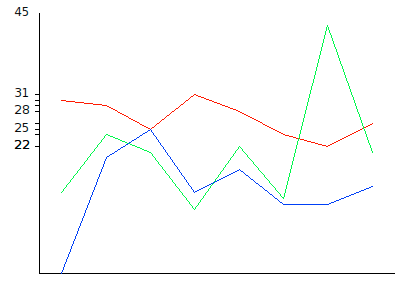
Careful with this! the labels only apply to the first data set (the red one) - if you look at the second data set where the max value is 43, you'll notice it corresponds to 35 in the diagram; and if you look at the third data set (blue) with a max value of 25, you'll also not that this corresponds to 35 in the diagram.
So, each data set is scaled to fit on the diagram, but doesn't change the range... -Chris
On Tue, May 15, 2012 at 12:19 AM, Chris Cunningham cunningham.cb@gmail.comwrote:
On Tue, May 8, 2012 at 3:18 PM, Andre Hora andrehoraa@gmail.com wrote:
Hi,
[cut]
model1 := #(30 29 25 31 28 24 22 26).
model2 := #(14 24 21 11 22 13 43 21).
model3 := #(0 20 25 14 18 12 12 15).
[cut]
diag2 := (ESDiagramRenderer new lineDiagram)
    y: #yourself;
    defaultColor: Color green;
    models: model2;
    yourself.

diag3 := (ESDiagramRenderer new lineDiagram)
    y: #yourself;
    defaultColor: Color blue;
    models: model3;
    yourself.
[snip]
Careful with this! the labels only apply to the first data set (the red one) - if you look at the second data set where the max value is 43, you'll notice it corresponds to 35 in the diagram; and if you look at the third data set (blue) with a max value of 25, you'll also not that this corresponds to 35 in the diagram.
So, each data set is scaled to fit on the diagram, but doesn't change the range...
Indeed, and to avoid that one can use the "preferredAxisMaxY:" lineBarCompositeDiagram2 "self new lineBarCompositeDiagram2"
| diag1 diag2 diag3 compDiag model1 model2 model3 |

model1 := #(30 29 25 31 28 24 22 26).
model2 := #(14 24 21 11 22 13 43 21).
model3 := #(0 20 25 14 18 12 12 15).

diag1 := (ESDiagramRenderer new lineDiagram)
    y: #yourself;
    models: model1;
    valueAxis;
    defaultColor: Color red;
    yourself.


diag2 := (ESDiagramRenderer new lineDiagram)
    y: #yourself;
    defaultColor: Color green;
    models: model2;
    yourself.

diag3 := (ESDiagramRenderer new lineDiagram)
    y: #yourself;
    defaultColor: Color blue;
    models: model3;
    yourself.

compDiag := ESDiagramRenderer new.
(compDiag compositeDiagram)
    add: diag1;
    add: diag2;
    add: diag3;
    preferredAxisMaxY: 45.
^ compDiag open
-Chris
Moose-dev mailing list Moose-dev@iam.unibe.ch https://www.iam.unibe.ch/mailman/listinfo/moose-dev
On Mon, May 14, 2012 at 3:40 PM, Andre Hora andrehoraa@gmail.com wrote:
On Tue, May 15, 2012 at 12:19 AM, Chris Cunningham cunningham.cb@gmail.com wrote:
On Tue, May 8, 2012 at 3:18 PM, Andre Hora andrehoraa@gmail.com wrote:
Hi,
[cut]
model1 := #(30 29 25 31 28 24 22 26). model2 := #(14 24 21 11 22 13 43 21). model3 := #(0 20 25 14 18 12 12 15).
[cut]
diag2 := (ESDiagramRenderer new lineDiagram) y: #yourself; defaultColor: Color green; models: model2; yourself.
diag3 := (ESDiagramRenderer new lineDiagram) y: #yourself; defaultColor: Color blue; models: model3; yourself.
[snip]
Careful with this! the labels only apply to the first data set (the red one) - if you look at the second data set where the max value is 43, you'll notice it corresponds to 35 in the diagram; and if you look at the third data set (blue) with a max value of 25, you'll also not that this corresponds to 35 in the diagram.
So, each data set is scaled to fit on the diagram, but doesn't change the range...
Indeed, and to avoid that one can use the "preferredAxisMaxY:"
lineBarCompositeDiagram2 "self new lineBarCompositeDiagram2"
| diag1 diag2 diag3 compDiag model1 model2 model3 |
model1 := #(30 29 25 31 28 24 22 26). model2 := #(14 24 21 11 22 13 43 21). model3 := #(0 20 25 14 18 12 12 15).
diag1 := (ESDiagramRenderer new lineDiagram) y: #yourself; models: model1; valueAxis; defaultColor: Color red; yourself.
diag2 := (ESDiagramRenderer new lineDiagram) y: #yourself; defaultColor: Color green; models: model2; yourself.
diag3 := (ESDiagramRenderer new lineDiagram) y: #yourself; defaultColor: Color blue; models: model3; yourself.
compDiag := ESDiagramRenderer new. (compDiag compositeDiagram) add: diag1; add: diag2; add: diag3; preferredAxisMaxY: 45. ^ compDiag open
-Chris
Moose-dev mailing list Moose-dev@iam.unibe.ch https://www.iam.unibe.ch/mailman/listinfo/moose-dev
-- Andre Hora
Moose-dev mailing list Moose-dev@iam.unibe.ch https://www.iam.unibe.ch/mailman/listinfo/moose-dev
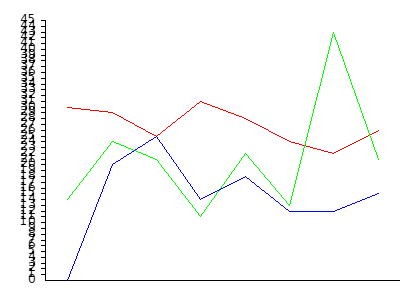
Yes, that is nice. However, when I run it (using the latest ConfigurationOfEyeSee loadDefault), I get different labels - one label for every value, which is undesirable. In a different test with a max Y value of 16,000, it is unreadable and incredibly slow.
This is from an Seaside oneclick 3.0.6, based on Pharo 1.3, I believe.
-Chris
On Mon, May 14, 2012 at 4:00 PM, Chris Cunningham cunningham.cb@gmail.com wrote:
On Mon, May 14, 2012 at 3:40 PM, Andre Hora andrehoraa@gmail.com wrote:
On Tue, May 15, 2012 at 12:19 AM, Chris Cunningham cunningham.cb@gmail.com wrote:
On Tue, May 8, 2012 at 3:18 PM, Andre Hora andrehoraa@gmail.com wrote:
Hi,
[cut]
model1 := #(30 29 25 31 28 24 22 26). model2 := #(14 24 21 11 22 13 43 21). model3 := #(0 20 25 14 18 12 12 15).
[cut]
diag2 := (ESDiagramRenderer new lineDiagram) y: #yourself; defaultColor: Color green; models: model2; yourself.
diag3 := (ESDiagramRenderer new lineDiagram) y: #yourself; defaultColor: Color blue; models: model3; yourself.
[snip]
Careful with this! the labels only apply to the first data set (the red one) - if you look at the second data set where the max value is 43, you'll notice it corresponds to 35 in the diagram; and if you look at the third data set (blue) with a max value of 25, you'll also not that this corresponds to 35 in the diagram.
So, each data set is scaled to fit on the diagram, but doesn't change the range...
Indeed, and to avoid that one can use the "preferredAxisMaxY:"
lineBarCompositeDiagram2 "self new lineBarCompositeDiagram2"
| diag1 diag2 diag3 compDiag model1 model2 model3 |
model1 := #(30 29 25 31 28 24 22 26). model2 := #(14 24 21 11 22 13 43 21). model3 := #(0 20 25 14 18 12 12 15).
diag1 := (ESDiagramRenderer new lineDiagram) y: #yourself; models: model1; valueAxis; defaultColor: Color red; yourself.
diag2 := (ESDiagramRenderer new lineDiagram) y: #yourself; defaultColor: Color green; models: model2; yourself.
diag3 := (ESDiagramRenderer new lineDiagram) y: #yourself; defaultColor: Color blue; models: model3; yourself.
compDiag := ESDiagramRenderer new. (compDiag compositeDiagram) add: diag1; add: diag2; add: diag3; preferredAxisMaxY: 45. ^ compDiag open
-Chris
Moose-dev mailing list Moose-dev@iam.unibe.ch https://www.iam.unibe.ch/mailman/listinfo/moose-dev
-- Andre Hora
Moose-dev mailing list Moose-dev@iam.unibe.ch https://www.iam.unibe.ch/mailman/listinfo/moose-dev
Yes, that is nice. However, when I run it (using the latest ConfigurationOfEyeSee loadDefault), I get different labels - one label for every value, which is undesirable. In a different test with a max Y value of 16,000, it is unreadable and incredibly slow.
This is from an Seaside oneclick 3.0.6, based on Pharo 1.3, I believe.
-Chris
Never mind - I had missed that you changed the first axis call from #regularAxis to #valueAxis - with that, the axis numbers are reasonable - and it doesn't cause the image to come to a virtual standstill.
That said, is there a way to force regular axis on this diagram? Could I get a label every every 10 multiple, plus say the 45 as well?
-Chris
On Tue, May 15, 2012 at 1:06 AM, Chris Cunningham cunningham.cb@gmail.comwrote:
On Mon, May 14, 2012 at 4:00 PM, Chris Cunningham cunningham.cb@gmail.com wrote:
On Mon, May 14, 2012 at 3:40 PM, Andre Hora andrehoraa@gmail.com
wrote:
On Tue, May 15, 2012 at 12:19 AM, Chris Cunningham <
cunningham.cb@gmail.com>
wrote:
On Tue, May 8, 2012 at 3:18 PM, Andre Hora andrehoraa@gmail.com
wrote:
Hi,
[cut]
model1 := #(30 29 25 31 28 24 22 26). model2 := #(14 24 21 11 22 13 43 21). model3 := #(0 20 25 14 18 12 12 15).[cut]
diag2 := (ESDiagramRenderer new lineDiagram) y: #yourself; defaultColor: Color green; models: model2; yourself. diag3 := (ESDiagramRenderer new lineDiagram) y: #yourself; defaultColor: Color blue; models: model3; yourself.[snip]
Careful with this! the labels only apply to the first data set (the red one) - if you look at the second data set where the max value is 43, you'll notice it corresponds to 35 in the diagram; and if you look at the third data set (blue) with a max value of 25, you'll also not that this corresponds to 35 in the diagram.
So, each data set is scaled to fit on the diagram, but doesn't change the range...
Indeed, and to avoid that one can use the "preferredAxisMaxY:"
lineBarCompositeDiagram2 "self new lineBarCompositeDiagram2"
| diag1 diag2 diag3 compDiag model1 model2 model3 | model1 := #(30 29 25 31 28 24 22 26). model2 := #(14 24 21 11 22 13 43 21). model3 := #(0 20 25 14 18 12 12 15). diag1 := (ESDiagramRenderer new lineDiagram) y: #yourself; models: model1; valueAxis; defaultColor: Color red; yourself. diag2 := (ESDiagramRenderer new lineDiagram) y: #yourself; defaultColor: Color green; models: model2; yourself. diag3 := (ESDiagramRenderer new lineDiagram) y: #yourself; defaultColor: Color blue; models: model3; yourself. compDiag := ESDiagramRenderer new. (compDiag compositeDiagram) add: diag1; add: diag2; add: diag3; preferredAxisMaxY: 45. ^ compDiag open-Chris
Moose-dev mailing list Moose-dev@iam.unibe.ch https://www.iam.unibe.ch/mailman/listinfo/moose-dev
-- Andre Hora
Moose-dev mailing list Moose-dev@iam.unibe.ch https://www.iam.unibe.ch/mailman/listinfo/moose-dev
Yes, that is nice. However, when I run it (using the latest ConfigurationOfEyeSee loadDefault), I get different labels - one label for every value, which is undesirable. In a different test with a max Y value of 16,000, it is unreadable and incredibly slow.
This is from an Seaside oneclick 3.0.6, based on Pharo 1.3, I believe.
-Chris
Never mind - I had missed that you changed the first axis call from #regularAxis to #valueAxis - with that, the axis numbers are reasonable - and it doesn't cause the image to come to a virtual standstill.
That said, is there a way to force regular axis on this diagram? Could I get a label every every 10 multiple, plus say the 45 as well?
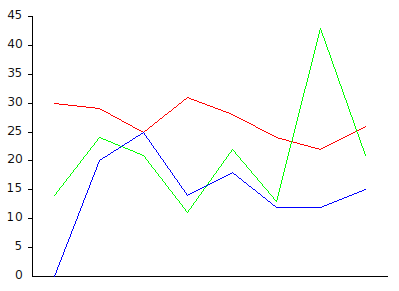
Chris, if you download the last EyeSee the regular axis (#regularAxis) will work fine. It automatically creates the steps size, instead of step 1. Below you can check the code: lineBarCompositeDiagram2 "self new lineBarCompositeDiagram2"
| diag1 diag2 diag3 compDiag model1 model2 model3 |

model1 := #(30 29 25 31 28 24 22 26).
model2 := #(14 24 21 11 22 13 43 21).
model3 := #(0 20 25 14 18 12 12 15).

diag1 := (ESDiagramRenderer new lineDiagram)
    y: #yourself;
    models: model1;
    regularAxis;

    defaultColor: Color red;
    yourself.

diag2 := (ESDiagramRenderer new lineDiagram)
    y: #yourself;
    defaultColor: Color green;
    models: model2;
    yourself.

diag3 := (ESDiagramRenderer new lineDiagram)
    y: #yourself;
    defaultColor: Color blue;
    models: model3;
    yourself.

compDiag := ESDiagramRenderer new.
(compDiag compositeDiagram)
    add: diag1;
    add: diag2;
    add: diag3;
    preferredAxisMaxY: 45.
^ compDiag open
-Chris
Moose-dev mailing list Moose-dev@iam.unibe.ch https://www.iam.unibe.ch/mailman/listinfo/moose-dev
Excellent!
Thanks for taking care of this, Andre.
Doru
On Tue, May 15, 2012 at 11:02 AM, Andre Hora andrehoraa@gmail.com wrote:
On Tue, May 15, 2012 at 1:06 AM, Chris Cunningham cunningham.cb@gmail.com wrote:
On Mon, May 14, 2012 at 4:00 PM, Chris Cunningham cunningham.cb@gmail.com wrote:
On Mon, May 14, 2012 at 3:40 PM, Andre Hora andrehoraa@gmail.com wrote:
On Tue, May 15, 2012 at 12:19 AM, Chris Cunningham cunningham.cb@gmail.com wrote:
On Tue, May 8, 2012 at 3:18 PM, Andre Hora andrehoraa@gmail.com wrote:
Hi,
[cut]
model1 := #(30 29 25 31 28 24 22 26). model2 := #(14 24 21 11 22 13 43 21). model3 := #(0 20 25 14 18 12 12 15).
[cut]
diag2 := (ESDiagramRenderer new lineDiagram) y: #yourself; defaultColor: Color green; models: model2; yourself.
diag3 := (ESDiagramRenderer new lineDiagram) y: #yourself; defaultColor: Color blue; models: model3; yourself.
[snip]
Careful with this! the labels only apply to the first data set (the red one) - if you look at the second data set where the max value is 43, you'll notice it corresponds to 35 in the diagram; and if you look at the third data set (blue) with a max value of 25, you'll also not that this corresponds to 35 in the diagram.
So, each data set is scaled to fit on the diagram, but doesn't change the range...
Indeed, and to avoid that one can use the "preferredAxisMaxY:"
lineBarCompositeDiagram2 "self new lineBarCompositeDiagram2"
| diag1 diag2 diag3 compDiag model1 model2 model3 |
model1 := #(30 29 25 31 28 24 22 26). model2 := #(14 24 21 11 22 13 43 21). model3 := #(0 20 25 14 18 12 12 15).
diag1 := (ESDiagramRenderer new lineDiagram) y: #yourself; models: model1; valueAxis; defaultColor: Color red; yourself.
diag2 := (ESDiagramRenderer new lineDiagram) y: #yourself; defaultColor: Color green; models: model2; yourself.
diag3 := (ESDiagramRenderer new lineDiagram) y: #yourself; defaultColor: Color blue; models: model3; yourself.
compDiag := ESDiagramRenderer new. (compDiag compositeDiagram) add: diag1; add: diag2; add: diag3; preferredAxisMaxY: 45. ^ compDiag open
-Chris
Moose-dev mailing list Moose-dev@iam.unibe.ch https://www.iam.unibe.ch/mailman/listinfo/moose-dev
-- Andre Hora
Moose-dev mailing list Moose-dev@iam.unibe.ch https://www.iam.unibe.ch/mailman/listinfo/moose-dev
Yes, that is nice. However, when I run it (using the latest ConfigurationOfEyeSee loadDefault), I get different labels - one label for every value, which is undesirable. In a different test with a max Y value of 16,000, it is unreadable and incredibly slow.
This is from an Seaside oneclick 3.0.6, based on Pharo 1.3, I believe.
-Chris
Never mind - I had missed that you changed the first axis call from #regularAxis to #valueAxis - with that, the axis numbers are reasonable - and it doesn't cause the image to come to a virtual standstill.
That said, is there a way to force regular axis on this diagram? Could I get a label every every 10 multiple, plus say the 45 as well?
Chris, if you download the last EyeSee the regular axis (#regularAxis) will work fine. It automatically creates the steps size, instead of step 1. Below you can check the code:
lineBarCompositeDiagram2 "self new lineBarCompositeDiagram2"
| diag1 diag2 diag3 compDiag model1 model2 model3 |

model1 := #(30 29 25 31 28 24 22 26).
model2 := #(14 24 21 11 22 13 43 21).
model3 := #(0 20 25 14 18 12 12 15).

diag1 := (ESDiagramRenderer new lineDiagram)
    y: #yourself;
    models: model1;
    regularAxis;

    defaultColor: Color red;
    yourself.

diag2 := (ESDiagramRenderer new lineDiagram)
    y: #yourself;
    defaultColor: Color green;
    models: model2;
    yourself.

diag3 := (ESDiagramRenderer new lineDiagram)
    y: #yourself;
    defaultColor: Color blue;
    models: model3;
    yourself.

compDiag := ESDiagramRenderer new.
(compDiag compositeDiagram)
    add: diag1;
    add: diag2;
    add: diag3;
    preferredAxisMaxY: 45.
^ compDiag open
-Chris
Moose-dev mailing list Moose-dev@iam.unibe.ch https://www.iam.unibe.ch/mailman/listinfo/moose-dev
-- Andre Hora
Moose-dev mailing list Moose-dev@iam.unibe.ch https://www.iam.unibe.ch/mailman/listinfo/moose-dev
On Tue, May 15, 2012 at 2:02 AM, Andre Hora andrehoraa@gmail.com wrote:
Chris, if you download the last EyeSee the regular axis (#regularAxis) will work fine. It automatically creates the steps size, instead of step 1. Below you can check the code:
lineBarCompositeDiagram2 "self new lineBarCompositeDiagram2"
| diag1 diag2 diag3 compDiag model1 model2 model3 |
model1 := #(30 29 25 31 28 24 22 26). model2 := #(14 24 21 11 22 13 43 21). model3 := #(0 20 25 14 18 12 12 15).
diag1 := (ESDiagramRenderer new lineDiagram) y: #yourself; models: model1; regularAxis;
defaultColor: Color red; yourself.
diag2 := (ESDiagramRenderer new lineDiagram) y: #yourself; defaultColor: Color green; models: model2; yourself.
diag3 := (ESDiagramRenderer new lineDiagram) y: #yourself; defaultColor: Color blue; models: model3; yourself.
compDiag := ESDiagramRenderer new. (compDiag compositeDiagram) add: diag1; add: diag2; add: diag3; preferredAxisMaxY: 45. ^ compDiag open
-Chris
Moose-dev mailing list Moose-dev@iam.unibe.ch https://www.iam.unibe.ch/mailman/listinfo/moose-dev
-- Andre Hora
Andre, That does look good. Which repository is the latest stored in?
-Chris
EyeSee in squeaksource. On May 15, 2012 10:16 PM, "Chris Cunningham" cunningham.cb@gmail.com wrote:
On Tue, May 15, 2012 at 2:02 AM, Andre Hora andrehoraa@gmail.com wrote:
Chris, if you download the last EyeSee the regular axis (#regularAxis)
will
work fine. It automatically creates the steps size, instead of step 1. Below you can check the code:
lineBarCompositeDiagram2 "self new lineBarCompositeDiagram2"
| diag1 diag2 diag3 compDiag model1 model2 model3 | model1 := #(30 29 25 31 28 24 22 26). model2 := #(14 24 21 11 22 13 43 21). model3 := #(0 20 25 14 18 12 12 15). diag1 := (ESDiagramRenderer new lineDiagram) y: #yourself; models: model1; regularAxis; defaultColor: Color red; yourself. diag2 := (ESDiagramRenderer new lineDiagram) y: #yourself; defaultColor: Color green; models: model2; yourself. diag3 := (ESDiagramRenderer new lineDiagram) y: #yourself; defaultColor: Color blue; models: model3; yourself. compDiag := ESDiagramRenderer new. (compDiag compositeDiagram) add: diag1; add: diag2; add: diag3; preferredAxisMaxY: 45. ^ compDiag open-Chris
Moose-dev mailing list Moose-dev@iam.unibe.ch https://www.iam.unibe.ch/mailman/listinfo/moose-dev
-- Andre Hora
Andre, That does look good. Which repository is the latest stored in?
-Chris
Moose-dev mailing list Moose-dev@iam.unibe.ch https://www.iam.unibe.ch/mailman/listinfo/moose-dev
Thanks a lot Andre this works great :).
Take care.
Franco
On Tue, May 15, 2012 at 5:53 PM, Andre Hora andrehoraa@gmail.com wrote:
EyeSee in squeaksource. On May 15, 2012 10:16 PM, "Chris Cunningham" cunningham.cb@gmail.com wrote:
On Tue, May 15, 2012 at 2:02 AM, Andre Hora andrehoraa@gmail.com wrote:
Chris, if you download the last EyeSee the regular axis (#regularAxis)
will
work fine. It automatically creates the steps size, instead of step 1. Below you can check the code:
lineBarCompositeDiagram2 "self new lineBarCompositeDiagram2"
| diag1 diag2 diag3 compDiag model1 model2 model3 | model1 := #(30 29 25 31 28 24 22 26). model2 := #(14 24 21 11 22 13 43 21). model3 := #(0 20 25 14 18 12 12 15). diag1 := (ESDiagramRenderer new lineDiagram) y: #yourself; models: model1; regularAxis; defaultColor: Color red; yourself. diag2 := (ESDiagramRenderer new lineDiagram) y: #yourself; defaultColor: Color green; models: model2; yourself. diag3 := (ESDiagramRenderer new lineDiagram) y: #yourself; defaultColor: Color blue; models: model3; yourself. compDiag := ESDiagramRenderer new. (compDiag compositeDiagram) add: diag1; add: diag2; add: diag3; preferredAxisMaxY: 45. ^ compDiag open-Chris
Moose-dev mailing list Moose-dev@iam.unibe.ch https://www.iam.unibe.ch/mailman/listinfo/moose-dev
-- Andre Hora
Andre, That does look good. Which repository is the latest stored in?
-Chris
Moose-dev mailing list Moose-dev@iam.unibe.ch https://www.iam.unibe.ch/mailman/listinfo/moose-dev
Moose-dev mailing list Moose-dev@iam.unibe.ch https://www.iam.unibe.ch/mailman/listinfo/moose-dev
-
 Andre Hora
 -
 Chris Cunningham
 -
 Franco Sabadini
 -
 Juan Francisco Hurtado
 -
 Tudor Girba