
Hi everyone,
some time ago I saw a diagram consisting of two columns of words and lines showing associations between the words in both columns. It looked similar to the "parallel coordinates" diagram from this link: http://homes.cs.washington.edu/~jheer/files/zoo/ but with only two columns.
Now, I am not sure if I saw this in an email on a Pharo or Moose list and wanted to ask if it is already possible to create such diagrams with Roassal.
Thank you very much, Manfred

Hi Manfred,
The parallel coordinates is indeed easy to obtain in Roassal.
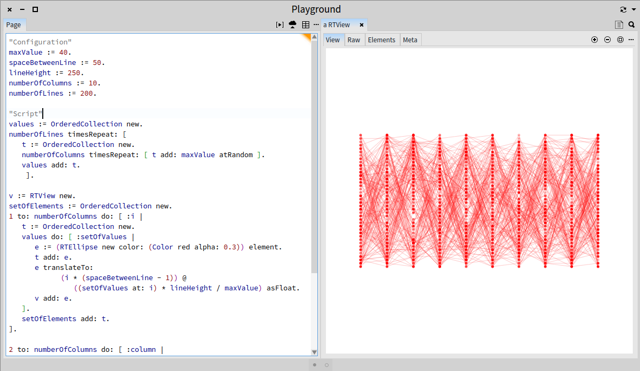
Here is a short example: -=-=-=-=-=-=-=-=-=-=-=-= "Configuration" maxValue := 40. spaceBetweenLine := 50. lineHeight := 250. numberOfColumns := 10. numberOfLines := 200.
"Script" values := OrderedCollection new. numberOfLines timesRepeat: [ t := OrderedCollection new. numberOfColumns timesRepeat: [ t add: maxValue atRandom ]. values add: t. ].
v := RTView new. setOfElements := OrderedCollection new. 1 to: numberOfColumns do: [ :i | t := OrderedCollection new. values do: [ :setOfValues | e := (RTEllipse new color: (Color red alpha: 0.3)) element. t add: e. e translateTo: (i * (spaceBetweenLine - 1)) @ ((setOfValues at: i) * lineHeight / maxValue) asFloat. v add: e. ]. setOfElements add: t. ].
2 to: numberOfColumns do: [ :column | t := OrderedCollection new. values doWithIndex: [ :setOfValues :index | line := (RTLine new color: (Color red alpha: 0.2)) edgeFrom: ((setOfElements at: (column - 1)) at: index) to: ((setOfElements at: column) at: index). v add: line. ]. ]. v -=-=-=-=-=-=-=-=-=-=-=-=
Best would be to define a new builder to allow for easy configuration. It would be easy to add colors
Cheers, Alexandre
Hi Alexandre,
thanks for the fast response and the nice script. I'll see if I can use it to produce the graph I'd like to have.
Best, Manfred
On Mon, May 4, 2015 at 5:06 PM, Alexandre Bergel alexandre.bergel@me.com wrote:
Hi Manfred,
The parallel coordinates is indeed easy to obtain in Roassal.
Here is a short example:
"Configuration" maxValue := 40. spaceBetweenLine := 50. lineHeight := 250. numberOfColumns := 10. numberOfLines := 200.
"Script" values := OrderedCollection new. numberOfLines timesRepeat: [ t := OrderedCollection new. numberOfColumns timesRepeat: [ t add: maxValue atRandom ]. values add: t. ].
v := RTView new. setOfElements := OrderedCollection new. 1 to: numberOfColumns do: [ :i | t := OrderedCollection new. values do: [ :setOfValues | e := (RTEllipse new color: (Color red alpha: 0.3)) element. t add: e. e translateTo: (i * (spaceBetweenLine - 1)) @ ((setOfValues at: i) * lineHeight / maxValue) asFloat. v add: e. ]. setOfElements add: t. ].
2 to: numberOfColumns do: [ :column | t := OrderedCollection new. values doWithIndex: [ :setOfValues :index | line := (RTLine new color: (Color red alpha: 0.2)) edgeFrom: ((setOfElements at: (column - 1)) at: index) to: ((setOfElements at: column) at: index). v add: line. ]. ]. v -=-=-=-=-=-=-=-=-=-=-=-=
Best would be to define a new builder to allow for easy configuration. It would be easy to add colors
Cheers, Alexandre -- _,.;:~^~:;._,.;:~^~:;._,.;:~^~:;._,.;:~^~:;._,.;: Alexandre Bergel http://www.bergel.eu ^~:;._,.;:~^~:;._,.;:~^~:;._,.;:~^~:;._,.;:~^~:;.
On May 4, 2015, at 5:38 AM, Manfred Kröhnert mkroehnert42@googlemail.com wrote:
Hi everyone,
some time ago I saw a diagram consisting of two columns of words and lines showing associations between the words in both columns. It looked similar to the "parallel coordinates" diagram from this link: http://homes.cs.washington.edu/~jheer/files/zoo/ but with only two columns.
Now, I am not sure if I saw this in an email on a Pharo or Moose list and wanted to ask if it is already possible to create such diagrams with Roassal.
Thank you very much, Manfred _______________________________________________ Moose-dev mailing list Moose-dev@iam.unibe.ch https://www.iam.unibe.ch/mailman/listinfo/moose-dev
Moose-dev mailing list Moose-dev@iam.unibe.ch https://www.iam.unibe.ch/mailman/listinfo/moose-dev
Ok, let us know!
Cheers, Alexandre
Dear Alexandre,
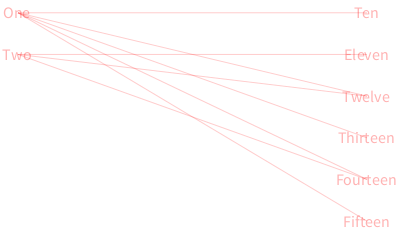
thanks for your initial version of the script. As promised, here is the adapted version of what I basically would like to achieve:
[image: Inline image 1]
======= "configuration" spaceBetweenLine := 350. lineHeight := 250.
"data" columns := #( #('One' 'Two') #('Ten' 'Eleven' 'Twelve' 'Thirteen' 'Fourteen' 'Fifteen') ). values := #( #(1 3 4 5 6) #(2 3 5) ).
numberOfColumns := columns size. columnHeight := columns reduce: [ :c1 :c2 | (c1 size) max: (c2 size) ].
v := RTView new. label := RTLabel text: [ :t | t ]. label color: (Color red alpha: 0.3).
"draw labels" setOfElements := OrderedCollection new. 1 to: numberOfColumns do: [ :i | | t labels | t := OrderedCollection new. labels := label elementsOn: (columns at: i). labels doWithIndex: [ :element :index | t add: element. element translateTo: (i * (spaceBetweenLine - 1)) @ (index * lineHeight / columnHeight). v add: element ]. setOfElements add: t. ].
"draw lines" 2 to: numberOfColumns do: [ :column | values doWithIndex: [ :setOfValues :index | setOfValues do: [ :toIndex | line := (RTLine new color: (Color red alpha: 0.2)) edgeFrom: ((setOfElements at: (column - 1)) at: index) to: ((setOfElements at: column) at: toIndex). v add: line ]. ]. ]. v =======
Now it only needs to be made a bit prettier (e.g. starting the lines at the edges of the label, not in the middle; make it deal correctly with multiple columns; ...).
Thank you very much, Manfred
On Mon, May 4, 2015 at 11:01 PM, Alexandre Bergel alexandre.bergel@me.com wrote:
Ok, let us know!
Cheers, Alexandre -- _,.;:~^~:;._,.;:~^~:;._,.;:~^~:;._,.;:~^~:;._,.;: Alexandre Bergel http://www.bergel.eu ^~:;._,.;:~^~:;._,.;:~^~:;._,.;:~^~:;._,.;:~^~:;.
On May 4, 2015, at 3:23 PM, Manfred Kröhnert mkroehnert42@googlemail.com wrote:
Hi Alexandre,
thanks for the fast response and the nice script. I'll see if I can use it to produce the graph I'd like to have.
Best, Manfred
On Mon, May 4, 2015 at 5:06 PM, Alexandre Bergel alexandre.bergel@me.com wrote:
Hi Manfred,
The parallel coordinates is indeed easy to obtain in Roassal.
Here is a short example:
"Configuration" maxValue := 40. spaceBetweenLine := 50. lineHeight := 250. numberOfColumns := 10. numberOfLines := 200.
"Script" values := OrderedCollection new. numberOfLines timesRepeat: [ t := OrderedCollection new. numberOfColumns timesRepeat: [ t add: maxValue atRandom ]. values add: t. ].
v := RTView new. setOfElements := OrderedCollection new. 1 to: numberOfColumns do: [ :i | t := OrderedCollection new. values do: [ :setOfValues | e := (RTEllipse new color: (Color red alpha: 0.3)) element. t add: e. e translateTo: (i * (spaceBetweenLine - 1)) @ ((setOfValues at: i) * lineHeight / maxValue) asFloat. v add: e. ]. setOfElements add: t. ].
2 to: numberOfColumns do: [ :column | t := OrderedCollection new. values doWithIndex: [ :setOfValues :index | line := (RTLine new color: (Color red alpha: 0.2)) edgeFrom: ((setOfElements at: (column - 1)) at: index) to: ((setOfElements at: column) at: index). v add: line. ]. ]. v -=-=-=-=-=-=-=-=-=-=-=-=
Best would be to define a new builder to allow for easy configuration. It would be easy to add colors
Cheers, Alexandre -- _,.;:~^~:;._,.;:~^~:;._,.;:~^~:;._,.;:~^~:;._,.;: Alexandre Bergel http://www.bergel.eu ^~:;._,.;:~^~:;._,.;:~^~:;._,.;:~^~:;._,.;:~^~:;.
On May 4, 2015, at 5:38 AM, Manfred Kröhnert mkroehnert42@googlemail.com wrote:
Hi everyone,
some time ago I saw a diagram consisting of two columns of words and lines showing associations between the words in both columns. It looked similar to the "parallel coordinates" diagram from this link: http://homes.cs.washington.edu/~jheer/files/zoo/ but with only two columns.
Now, I am not sure if I saw this in an email on a Pharo or Moose list and wanted to ask if it is already possible to create such diagrams with Roassal.
Thank you very much, Manfred
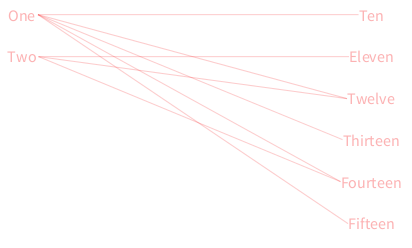
Hi Manfred,
You just need to have a proper attach point. Consider this slightly modified version:
"configuration" spaceBetweenLine := 350. lineHeight := 250.
"data" columns := #( #('One' 'Two') #('Ten' 'Eleven' 'Twelve' 'Thirteen' 'Fourteen' 'Fifteen') ). values := #( #(1 3 4 5 6) #(2 3 5) ).
numberOfColumns := columns size. columnHeight := columns reduce: [ :c1 :c2 | (c1 size) max: (c2 size) ].
v := RTView new. label := RTLabel text: [ :t | t ]. label color: (Color red alpha: 0.3).
"draw labels" setOfElements := OrderedCollection new. 1 to: numberOfColumns do: [ :i | | t labels | t := OrderedCollection new. labels := label elementsOn: (columns at: i). labels doWithIndex: [ :element :index | t add: element. element translateTo: (i * (spaceBetweenLine - 1)) @ (index * lineHeight / columnHeight). v add: element ]. setOfElements add: t. ].
"draw lines" 2 to: numberOfColumns do: [ :column | values doWithIndex: [ :setOfValues :index | setOfValues do: [ :toIndex | lineShape := RTLine new color: (Color red alpha: 0.2). lineShape attachPoint: RTShorterDistanceAttachPoint new. line := lineShape edgeFrom: ((setOfElements at: (column - 1)) at: index) to: ((setOfElements at: column) at: toIndex). v add: line ]. ]. ]. v
Regarding the multiple columns, give a try first and we will iterate.
Cheers, Alexandre
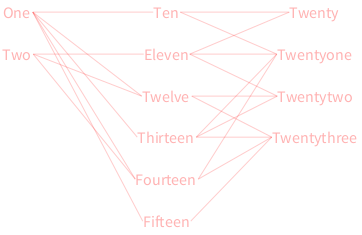
Thanks Alexandre,
great advice once again.
Here is the current result
[image: Inline image 1]
and the script:
========
"configuration" spaceBetweenLine := 150. lineHeight := 250. labelColor := (Color red alpha: 0.3). lineColor := (Color red alpha: 0.2).
"columns: Array of column label Arrays" columns := #( #('One' 'Two') #('Ten' 'Eleven' 'Twelve' 'Thirteen' 'Fourteen' 'Fifteen') #('Twenty' 'Twentyone' 'Twentytwo' 'Twentythree') ).
"values: Array of columns column: Array of columnelements columnelement: Array of indices the element is associated with in the next column" values := #( #( #(1 3 4 5 6) #(2 3 5) ) #( #(1 2) #(1 2 3) #(3 4) #(2 3 4) #(2 4) #(4) ) ).
numberOfColumns := columns size. maxColumnElements := (columns collect: [ :element | element size]) reduce: [ :size1 :size2 | size1 max: size2 ].
v := RTView new. label := RTLabel text: [ :t | t ]. label color: labelColor.
"draw labels" columnElements := OrderedCollection new. 1 to: numberOfColumns do: [ :i | | t labels | t := OrderedCollection new. labels := label elementsOn: (columns at: i). labels doWithIndex: [ :element :index | t add: element. element translateTo: (i * (spaceBetweenLine - 1)) @ (index * lineHeight / maxColumnElements). v add: element ]. columnElements add: t. ]. v.
"draw lines" 2 to: numberOfColumns do: [ :column | (values at: column - 1) doWithIndex: [ :setOfValues :index | setOfValues do: [ :setIndex | | fromElement toElement line | fromElement := ((columnElements at: (column - 1)) at: index). toElement := ((columnElements at: column) at: setIndex). lineShape := RTLine new color: lineColor. lineShape attachPoint: RTShorterDistanceAttachPoint new. line := lineShape edgeFrom: fromElement to: toElement. v add: line ]. ]. ]. v
========
The last thing I am going to experiment with will be to replace the straight lines with RTBezierLine.
Thanks, Manfred
On Fri, Jun 5, 2015 at 3:17 PM, Alexandre Bergel alexandre.bergel@me.com wrote:
Hi Manfred,
You just need to have a proper attach point. Consider this slightly modified version:
"configuration" spaceBetweenLine := 350. lineHeight := 250.
"data" columns := #( #('One' 'Two') #('Ten' 'Eleven' 'Twelve' 'Thirteen' 'Fourteen' 'Fifteen') ). values := #( #(1 3 4 5 6) #(2 3 5) ).
numberOfColumns := columns size. columnHeight := columns reduce: [ :c1 :c2 | (c1 size) max: (c2 size) ].
v := RTView new. label := RTLabel text: [ :t | t ]. label color: (Color red alpha: 0.3).
"draw labels" setOfElements := OrderedCollection new. 1 to: numberOfColumns do: [ :i | | t labels | t := OrderedCollection new. labels := label elementsOn: (columns at: i). labels doWithIndex: [ :element :index | t add: element. element translateTo: (i * (spaceBetweenLine - 1)) @ (index * lineHeight / columnHeight). v add: element ]. setOfElements add: t. ].
"draw lines" 2 to: numberOfColumns do: [ :column | values doWithIndex: [ :setOfValues :index | setOfValues do: [ :toIndex | lineShape := RTLine new color: (Color red alpha: 0.2). lineShape attachPoint: RTShorterDistanceAttachPoint new. line := lineShape edgeFrom: ((setOfElements at: (column - 1)) at: index) to: ((setOfElements at: column) at: toIndex). v add: line ]. ]. ]. v
Regarding the multiple columns, give a try first and we will iterate.
Cheers, Alexandre -- _,.;:~^~:;._,.;:~^~:;._,.;:~^~:;._,.;:~^~:;._,.;: Alexandre Bergel http://www.bergel.eu ^~:;._,.;:~^~:;._,.;:~^~:;._,.;:~^~:;._,.;:~^~:;.
Yeah!!! Looks good! Keep doing!
Alexandre
Hello Alexandre,
I am trying to revive this thread. Sorry for not posting any updates in such a long time. Unfortunately, I just did not have time to experiment with this any further.
My latest attempt was to replace the straight lines with BezierLine elements. The code and a screenshot can be found here: https://gist.github.com/mkroehnert/aa3d1d9913cb0f29a49f
It looks okay, but in my opinion, the code for creating the BezierLine is a bit cumbersome. Especially having to create invisible RTEllipse elements for control points.
Therefore, it would be nice to have your opinion on this. Is this correct, or are there better ways to achieve this?
Thanks a lot, Manfred
On Fri, Jun 5, 2015 at 10:50 PM, Alexandre Bergel alexandre.bergel@me.com wrote:
Yeah!!! Looks good! Keep doing!
Alexandre
_,.;:~^~:;._,.;:~^~:;._,.;:~^~:;._,.;:~^~:;._,.;: Alexandre Bergel http://www.bergel.eu ^~:;._,.;:~^~:;._,.;:~^~:;._,.;:~^~:;._,.;:~^~:;.
On Jun 5, 2015, at 12:42 PM, Manfred Kröhnert mkroehnert42@googlemail.com wrote:
Thanks Alexandre,
great advice once again.
Here is the current result
<ParallelCoordinates.png>
and the script:
========
"configuration" spaceBetweenLine := 150. lineHeight := 250. labelColor := (Color red alpha: 0.3). lineColor := (Color red alpha: 0.2).
"columns: Array of column label Arrays" columns := #( #('One' 'Two') #('Ten' 'Eleven' 'Twelve' 'Thirteen' 'Fourteen' 'Fifteen') #('Twenty' 'Twentyone' 'Twentytwo' 'Twentythree') ).
"values: Array of columns column: Array of columnelements columnelement: Array of indices the element is associated with in the next column" values := #( #( #(1 3 4 5 6) #(2 3 5) ) #( #(1 2) #(1 2 3) #(3 4) #(2 3 4) #(2 4) #(4) ) ).
numberOfColumns := columns size. maxColumnElements := (columns collect: [ :element | element size]) reduce: [ :size1 :size2 | size1 max: size2 ].
v := RTView new. label := RTLabel text: [ :t | t ]. label color: labelColor.
"draw labels" columnElements := OrderedCollection new. 1 to: numberOfColumns do: [ :i | | t labels | t := OrderedCollection new. labels := label elementsOn: (columns at: i). labels doWithIndex: [ :element :index | t add: element. element translateTo: (i * (spaceBetweenLine - 1)) @ (index * lineHeight / maxColumnElements). v add: element ]. columnElements add: t. ]. v.
"draw lines" 2 to: numberOfColumns do: [ :column | (values at: column - 1) doWithIndex: [ :setOfValues :index | setOfValues do: [ :setIndex | | fromElement toElement line | fromElement := ((columnElements at: (column - 1)) at: index). toElement := ((columnElements at: column) at: setIndex). lineShape := RTLine new color: lineColor. lineShape attachPoint: RTShorterDistanceAttachPoint new. line := lineShape edgeFrom: fromElement to: toElement. v add: line ]. ]. ]. v
========
The last thing I am going to experiment with will be to replace the straight lines with RTBezierLine.
Thanks, Manfred

RTBezierLine>>controllingElements: takes as an argument either elements (which you have dont; good if you want to display them), or direct values. You could also use RTSVGPath, but that would be probably more low-level.
On Sat, Oct 31, 2015 at 5:28 PM, Manfred Kröhnert < mkroehnert42@googlemail.com> wrote:
Hello Alexandre,
I am trying to revive this thread. Sorry for not posting any updates in such a long time. Unfortunately, I just did not have time to experiment with this any further.
My latest attempt was to replace the straight lines with BezierLine elements. The code and a screenshot can be found here: https://gist.github.com/mkroehnert/aa3d1d9913cb0f29a49f
It looks okay, but in my opinion, the code for creating the BezierLine is a bit cumbersome. Especially having to create invisible RTEllipse elements for control points.
Therefore, it would be nice to have your opinion on this. Is this correct, or are there better ways to achieve this?
Thanks a lot, Manfred
On Fri, Jun 5, 2015 at 10:50 PM, Alexandre Bergel <alexandre.bergel@me.com
wrote:
Yeah!!! Looks good! Keep doing!
Alexandre
_,.;:~^~:;._,.;:~^~:;._,.;:~^~:;._,.;:~^~:;._,.;: Alexandre Bergel http://www.bergel.eu ^~:;._,.;:~^~:;._,.;:~^~:;._,.;:~^~:;._,.;:~^~:;.
On Jun 5, 2015, at 12:42 PM, Manfred Kröhnert < mkroehnert42@googlemail.com> wrote:
Thanks Alexandre,
great advice once again.
Here is the current result
<ParallelCoordinates.png>
and the script:
========
"configuration" spaceBetweenLine := 150. lineHeight := 250. labelColor := (Color red alpha: 0.3). lineColor := (Color red alpha: 0.2).
"columns: Array of column label Arrays" columns := #( #('One' 'Two') #('Ten' 'Eleven' 'Twelve' 'Thirteen' 'Fourteen' 'Fifteen') #('Twenty' 'Twentyone' 'Twentytwo' 'Twentythree') ).
"values: Array of columns column: Array of columnelements columnelement: Array of indices the element is associated with in the next column" values := #( #( #(1 3 4 5 6) #(2 3 5) ) #( #(1 2) #(1 2 3) #(3 4) #(2 3 4) #(2 4) #(4) ) ).
numberOfColumns := columns size. maxColumnElements := (columns collect: [ :element | element size]) reduce: [ :size1 :size2 | size1 max: size2 ].
v := RTView new. label := RTLabel text: [ :t | t ]. label color: labelColor.
"draw labels" columnElements := OrderedCollection new. 1 to: numberOfColumns do: [ :i | | t labels | t := OrderedCollection new. labels := label elementsOn: (columns at: i). labels doWithIndex: [ :element :index | t add: element. element translateTo: (i * (spaceBetweenLine - 1)) @ (index * lineHeight / maxColumnElements). v add: element ]. columnElements add: t. ]. v.
"draw lines" 2 to: numberOfColumns do: [ :column | (values at: column - 1) doWithIndex: [ :setOfValues :index | setOfValues do: [ :setIndex | | fromElement toElement line | fromElement := ((columnElements at: (column - 1)) at: index). toElement := ((columnElements at: column) at: setIndex). lineShape := RTLine new color: lineColor. lineShape attachPoint: RTShorterDistanceAttachPoint new. line := lineShape edgeFrom: fromElement to: toElement. v add: line ]. ]. ]. v
========
The last thing I am going to experiment with will be to replace the straight lines with RTBezierLine.
Thanks, Manfred
Moose-dev mailing list Moose-dev@list.inf.unibe.ch https://www.list.inf.unibe.ch/listinfo/moose-dev
Hello Peter,
thanks for the info. I am going to use the new methods Alexandre introduce but will keep this in mind if I have to create more complex Bezier lines.
Best, Manfred
On Sat, Oct 31, 2015 at 5:38 PM, Peter Uhnák i.uhnak@gmail.com wrote:
RTBezierLine>>controllingElements: takes as an argument either elements (which you have dont; good if you want to display them), or direct values. You could also use RTSVGPath, but that would be probably more low-level.
On Sat, Oct 31, 2015 at 5:28 PM, Manfred Kröhnert < mkroehnert42@googlemail.com> wrote:
Hello Alexandre,
I am trying to revive this thread. Sorry for not posting any updates in such a long time. Unfortunately, I just did not have time to experiment with this any further.
My latest attempt was to replace the straight lines with BezierLine elements. The code and a screenshot can be found here: https://gist.github.com/mkroehnert/aa3d1d9913cb0f29a49f
It looks okay, but in my opinion, the code for creating the BezierLine is a bit cumbersome. Especially having to create invisible RTEllipse elements for control points.
Therefore, it would be nice to have your opinion on this. Is this correct, or are there better ways to achieve this?
Thanks a lot, Manfred
On Fri, Jun 5, 2015 at 10:50 PM, Alexandre Bergel < alexandre.bergel@me.com> wrote:
Yeah!!! Looks good! Keep doing!
Alexandre
_,.;:~^~:;._,.;:~^~:;._,.;:~^~:;._,.;:~^~:;._,.;: Alexandre Bergel http://www.bergel.eu ^~:;._,.;:~^~:;._,.;:~^~:;._,.;:~^~:;._,.;:~^~:;.
On Jun 5, 2015, at 12:42 PM, Manfred Kröhnert < mkroehnert42@googlemail.com> wrote:
Thanks Alexandre,
great advice once again.
Here is the current result
<ParallelCoordinates.png>
and the script:
========
"configuration" spaceBetweenLine := 150. lineHeight := 250. labelColor := (Color red alpha: 0.3). lineColor := (Color red alpha: 0.2).
"columns: Array of column label Arrays" columns := #( #('One' 'Two') #('Ten' 'Eleven' 'Twelve' 'Thirteen' 'Fourteen' 'Fifteen') #('Twenty' 'Twentyone' 'Twentytwo' 'Twentythree') ).
"values: Array of columns column: Array of columnelements columnelement: Array of indices the element is associated with in the next column" values := #( #( #(1 3 4 5 6) #(2 3 5) ) #( #(1 2) #(1 2 3) #(3 4) #(2 3 4) #(2 4) #(4) ) ).
numberOfColumns := columns size. maxColumnElements := (columns collect: [ :element | element size]) reduce: [ :size1 :size2 | size1 max: size2 ].
v := RTView new. label := RTLabel text: [ :t | t ]. label color: labelColor.
"draw labels" columnElements := OrderedCollection new. 1 to: numberOfColumns do: [ :i | | t labels | t := OrderedCollection new. labels := label elementsOn: (columns at: i). labels doWithIndex: [ :element :index | t add: element. element translateTo: (i * (spaceBetweenLine - 1)) @ (index * lineHeight / maxColumnElements). v add: element ]. columnElements add: t. ]. v.
"draw lines" 2 to: numberOfColumns do: [ :column | (values at: column - 1) doWithIndex: [ :setOfValues :index | setOfValues do: [ :setIndex | | fromElement toElement line | fromElement := ((columnElements at: (column - 1)) at: index). toElement := ((columnElements at: column) at: setIndex). lineShape := RTLine new color: lineColor. lineShape attachPoint: RTShorterDistanceAttachPoint new. line := lineShape edgeFrom: fromElement to: toElement. v add: line ]. ]. ]. v
========
The last thing I am going to experiment with will be to replace the straight lines with RTBezierLine.
Thanks, Manfred
Moose-dev mailing list Moose-dev@list.inf.unibe.ch https://www.list.inf.unibe.ch/listinfo/moose-dev
Moose-dev mailing list Moose-dev@list.inf.unibe.ch https://www.list.inf.unibe.ch/listinfo/moose-dev
Let us know
Cheers, Alexandre
On Nov 6, 2015, at 1:38 PM, Manfred Kröhnert mkroehnert42@googlemail.com wrote:
Hello Peter,
thanks for the info. I am going to use the new methods Alexandre introduce but will keep this in mind if I have to create more complex Bezier lines.
Best, Manfred
On Sat, Oct 31, 2015 at 5:38 PM, Peter Uhnák i.uhnak@gmail.com wrote: RTBezierLine>>controllingElements: takes as an argument either elements (which you have dont; good if you want to display them), or direct values. You could also use RTSVGPath, but that would be probably more low-level.
On Sat, Oct 31, 2015 at 5:28 PM, Manfred Kröhnert mkroehnert42@googlemail.com wrote: Hello Alexandre,
I am trying to revive this thread. Sorry for not posting any updates in such a long time. Unfortunately, I just did not have time to experiment with this any further.
My latest attempt was to replace the straight lines with BezierLine elements. The code and a screenshot can be found here: https://gist.github.com/mkroehnert/aa3d1d9913cb0f29a49f
It looks okay, but in my opinion, the code for creating the BezierLine is a bit cumbersome. Especially having to create invisible RTEllipse elements for control points.
Therefore, it would be nice to have your opinion on this. Is this correct, or are there better ways to achieve this?
Thanks a lot, Manfred
On Fri, Jun 5, 2015 at 10:50 PM, Alexandre Bergel alexandre.bergel@me.com wrote: Yeah!!! Looks good! Keep doing!
Alexandre
_,.;:~^~:;._,.;:~^~:;._,.;:~^~:;._,.;:~^~:;._,.;: Alexandre Bergel http://www.bergel.eu ^~:;._,.;:~^~:;._,.;:~^~:;._,.;:~^~:;._,.;:~^~:;.
On Jun 5, 2015, at 12:42 PM, Manfred Kröhnert mkroehnert42@googlemail.com wrote:
Thanks Alexandre,
great advice once again.
Here is the current result
<ParallelCoordinates.png>
and the script:
========
"configuration" spaceBetweenLine := 150. lineHeight := 250. labelColor := (Color red alpha: 0.3). lineColor := (Color red alpha: 0.2).
"columns: Array of column label Arrays" columns := #( #('One' 'Two') #('Ten' 'Eleven' 'Twelve' 'Thirteen' 'Fourteen' 'Fifteen') #('Twenty' 'Twentyone' 'Twentytwo' 'Twentythree') ).
"values: Array of columns column: Array of columnelements columnelement: Array of indices the element is associated with in the next column" values := #( #( #(1 3 4 5 6) #(2 3 5) ) #( #(1 2) #(1 2 3) #(3 4) #(2 3 4) #(2 4) #(4) ) ).
numberOfColumns := columns size. maxColumnElements := (columns collect: [ :element | element size]) reduce: [ :size1 :size2 | size1 max: size2 ].
v := RTView new. label := RTLabel text: [ :t | t ]. label color: labelColor.
"draw labels" columnElements := OrderedCollection new. 1 to: numberOfColumns do: [ :i | | t labels | t := OrderedCollection new. labels := label elementsOn: (columns at: i). labels doWithIndex: [ :element :index | t add: element. element translateTo: (i * (spaceBetweenLine - 1)) @ (index * lineHeight / maxColumnElements). v add: element ]. columnElements add: t. ]. v.
"draw lines" 2 to: numberOfColumns do: [ :column | (values at: column - 1) doWithIndex: [ :setOfValues :index | setOfValues do: [ :setIndex | | fromElement toElement line | fromElement := ((columnElements at: (column - 1)) at: index). toElement := ((columnElements at: column) at: setIndex). lineShape := RTLine new color: lineColor. lineShape attachPoint: RTShorterDistanceAttachPoint new. line := lineShape edgeFrom: fromElement to: toElement. v add: line ]. ]. ]. v
========
The last thing I am going to experiment with will be to replace the straight lines with RTBezierLine.
Thanks, Manfred
Moose-dev mailing list Moose-dev@list.inf.unibe.ch https://www.list.inf.unibe.ch/listinfo/moose-dev
Moose-dev mailing list Moose-dev@list.inf.unibe.ch https://www.list.inf.unibe.ch/listinfo/moose-dev
Moose-dev mailing list Moose-dev@list.inf.unibe.ch https://www.list.inf.unibe.ch/listinfo/moose-dev
Hi!
I think there is simpler way. I am away from my laptop now. On Monday or Tuesday I will reply you.
Alexandre
Le 31 oct. 2015 à 13:28, Manfred Kröhnert mkroehnert42@googlemail.com a écrit :
Hello Alexandre,
I am trying to revive this thread. Sorry for not posting any updates in such a long time. Unfortunately, I just did not have time to experiment with this any further.
My latest attempt was to replace the straight lines with BezierLine elements. The code and a screenshot can be found here: https://gist.github.com/mkroehnert/aa3d1d9913cb0f29a49f
It looks okay, but in my opinion, the code for creating the BezierLine is a bit cumbersome. Especially having to create invisible RTEllipse elements for control points.
Therefore, it would be nice to have your opinion on this. Is this correct, or are there better ways to achieve this?
Thanks a lot, Manfred
On Fri, Jun 5, 2015 at 10:50 PM, Alexandre Bergel alexandre.bergel@me.com wrote: Yeah!!! Looks good! Keep doing!
Alexandre
_,.;:~^~:;._,.;:~^~:;._,.;:~^~:;._,.;:~^~:;._,.;: Alexandre Bergel http://www.bergel.eu ^~:;._,.;:~^~:;._,.;:~^~:;._,.;:~^~:;._,.;:~^~:;.
On Jun 5, 2015, at 12:42 PM, Manfred Kröhnert mkroehnert42@googlemail.com wrote:
Thanks Alexandre,
great advice once again.
Here is the current result
<ParallelCoordinates.png>
and the script:
========
"configuration" spaceBetweenLine := 150. lineHeight := 250. labelColor := (Color red alpha: 0.3). lineColor := (Color red alpha: 0.2).
"columns: Array of column label Arrays" columns := #( #('One' 'Two') #('Ten' 'Eleven' 'Twelve' 'Thirteen' 'Fourteen' 'Fifteen') #('Twenty' 'Twentyone' 'Twentytwo' 'Twentythree') ).
"values: Array of columns column: Array of columnelements columnelement: Array of indices the element is associated with in the next column" values := #( #( #(1 3 4 5 6) #(2 3 5) ) #( #(1 2) #(1 2 3) #(3 4) #(2 3 4) #(2 4) #(4) ) ).
numberOfColumns := columns size. maxColumnElements := (columns collect: [ :element | element size]) reduce: [ :size1 :size2 | size1 max: size2 ].
v := RTView new. label := RTLabel text: [ :t | t ]. label color: labelColor.
"draw labels" columnElements := OrderedCollection new. 1 to: numberOfColumns do: [ :i | | t labels | t := OrderedCollection new. labels := label elementsOn: (columns at: i). labels doWithIndex: [ :element :index | t add: element. element translateTo: (i * (spaceBetweenLine - 1)) @ (index * lineHeight / maxColumnElements). v add: element ]. columnElements add: t. ]. v.
"draw lines" 2 to: numberOfColumns do: [ :column | (values at: column - 1) doWithIndex: [ :setOfValues :index | setOfValues do: [ :setIndex | | fromElement toElement line | fromElement := ((columnElements at: (column - 1)) at: index). toElement := ((columnElements at: column) at: setIndex). lineShape := RTLine new color: lineColor. lineShape attachPoint: RTShorterDistanceAttachPoint new. line := lineShape edgeFrom: fromElement to: toElement. v add: line ]. ]. ]. v
========
The last thing I am going to experiment with will be to replace the straight lines with RTBezierLine.
Thanks, Manfred
Moose-dev mailing list Moose-dev@list.inf.unibe.ch https://www.list.inf.unibe.ch/listinfo/moose-dev
Hi Manfred,
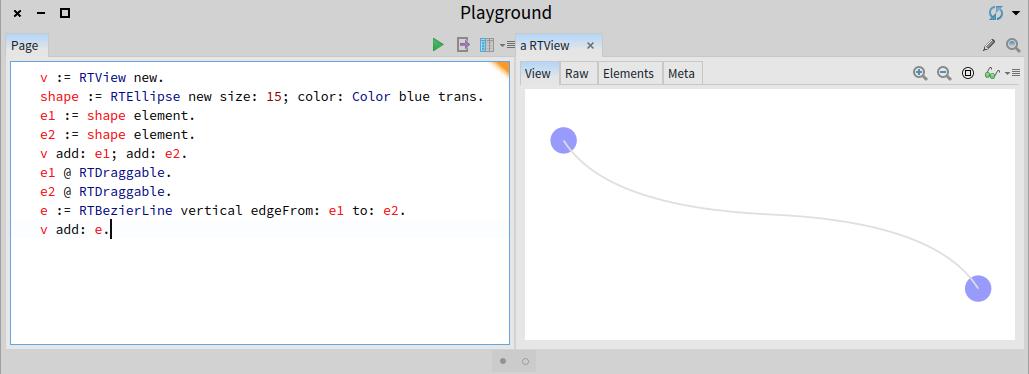
I have just updated Roassal with two methods #horizontal and #vertical defined on RTBezierLine. Here is an example on how to use it: v := RTView new. shape := RTEllipse new size: 15; color: Color blue trans. e1 := shape element. e2 := shape element. v add: e1; add: e2. e1 @ RTDraggable. e2 @ RTDraggable. e := RTBezierLine vertical edgeFrom: e1 to: e2. v add: e.
With this, you will not need to create intermediary elements. Something important, I strongly suggest you to have a dedicated builder. Having very long script is painful...
Cheers, Alexandre
Hello Alexandre,
thanks a lot. This convenience method works very well and I adjusted the script accordingly (https://gist.github.com/mkroehnert/aa3d1d9913cb0f29a49f).
I Agree with having a dedicated builder for this task makes a lot of sense. I am going to look at other Roassal builders for reference implementations, soon. Or is there additional material available on creating builders.
Thanks a lot, Manfred
On Mon, Nov 2, 2015 at 3:51 PM, Alexandre Bergel alexandre.bergel@me.com wrote:
Hi Manfred,
I have just updated Roassal with two methods #horizontal and #vertical defined on RTBezierLine. Here is an example on how to use it: v := RTView new. shape := RTEllipse new size: 15; color: Color blue trans. e1 := shape element. e2 := shape element. v add: e1; add: e2. e1 @ RTDraggable. e2 @ RTDraggable. e := RTBezierLine vertical edgeFrom: e1 to: e2. v add: e.
With this, you will not need to create intermediary elements. Something important, I strongly suggest you to have a dedicated builder. Having very long script is painful...
Cheers, Alexandre -- _,.;:~^~:;._,.;:~^~:;._,.;:~^~:;._,.;:~^~:;._,.;: Alexandre Bergel http://www.bergel.eu ^~:;._,.;:~^~:;._,.;:~^~:;._,.;:~^~:;._,.;:~^~:;.
On Oct 31, 2015, at 1:28 PM, Manfred Kröhnert mkroehnert42@googlemail.com wrote:
Hello Alexandre,
I am trying to revive this thread. Sorry for not posting any updates in such a long time. Unfortunately, I just did not have time to experiment with this any further.
My latest attempt was to replace the straight lines with BezierLine elements. The code and a screenshot can be found here: https://gist.github.com/mkroehnert/aa3d1d9913cb0f29a49f
It looks okay, but in my opinion, the code for creating the BezierLine is a bit cumbersome. Especially having to create invisible RTEllipse elements for control points.
Therefore, it would be nice to have your opinion on this. Is this correct, or are there better ways to achieve this?
Thanks a lot, Manfred
On Fri, Jun 5, 2015 at 10:50 PM, Alexandre Bergel <alexandre.bergel@me.com
wrote:
Yeah!!! Looks good! Keep doing!
Alexandre
_,.;:~^~:;._,.;:~^~:;._,.;:~^~:;._,.;:~^~:;._,.;: Alexandre Bergel http://www.bergel.eu ^~:;._,.;:~^~:;._,.;:~^~:;._,.;:~^~:;._,.;:~^~:;.
On Jun 5, 2015, at 12:42 PM, Manfred Kröhnert < mkroehnert42@googlemail.com> wrote:
Thanks Alexandre,
great advice once again.
Here is the current result
<ParallelCoordinates.png>
and the script:
========
"configuration" spaceBetweenLine := 150. lineHeight := 250. labelColor := (Color red alpha: 0.3). lineColor := (Color red alpha: 0.2).
"columns: Array of column label Arrays" columns := #( #('One' 'Two') #('Ten' 'Eleven' 'Twelve' 'Thirteen' 'Fourteen' 'Fifteen') #('Twenty' 'Twentyone' 'Twentytwo' 'Twentythree') ).
"values: Array of columns column: Array of columnelements columnelement: Array of indices the element is associated with in the next column" values := #( #( #(1 3 4 5 6) #(2 3 5) ) #( #(1 2) #(1 2 3) #(3 4) #(2 3 4) #(2 4) #(4) ) ).
numberOfColumns := columns size. maxColumnElements := (columns collect: [ :element | element size]) reduce: [ :size1 :size2 | size1 max: size2 ].
v := RTView new. label := RTLabel text: [ :t | t ]. label color: labelColor.
"draw labels" columnElements := OrderedCollection new. 1 to: numberOfColumns do: [ :i | | t labels | t := OrderedCollection new. labels := label elementsOn: (columns at: i). labels doWithIndex: [ :element :index | t add: element. element translateTo: (i * (spaceBetweenLine - 1)) @ (index * lineHeight / maxColumnElements). v add: element ]. columnElements add: t. ]. v.
"draw lines" 2 to: numberOfColumns do: [ :column | (values at: column - 1) doWithIndex: [ :setOfValues :index | setOfValues do: [ :setIndex | | fromElement toElement line | fromElement := ((columnElements at: (column - 1)) at: index). toElement := ((columnElements at: column) at: setIndex). lineShape := RTLine new color: lineColor. lineShape attachPoint: RTShorterDistanceAttachPoint new. line := lineShape edgeFrom: fromElement to: toElement. v add: line ]. ]. ]. v
========
The last thing I am going to experiment with will be to replace the straight lines with RTBezierLine.
Thanks, Manfred
-
 Alexandre Bergel
 -
 Manfred Kröhnert
 -
 Peter Uhnák