
Thank you Alex.
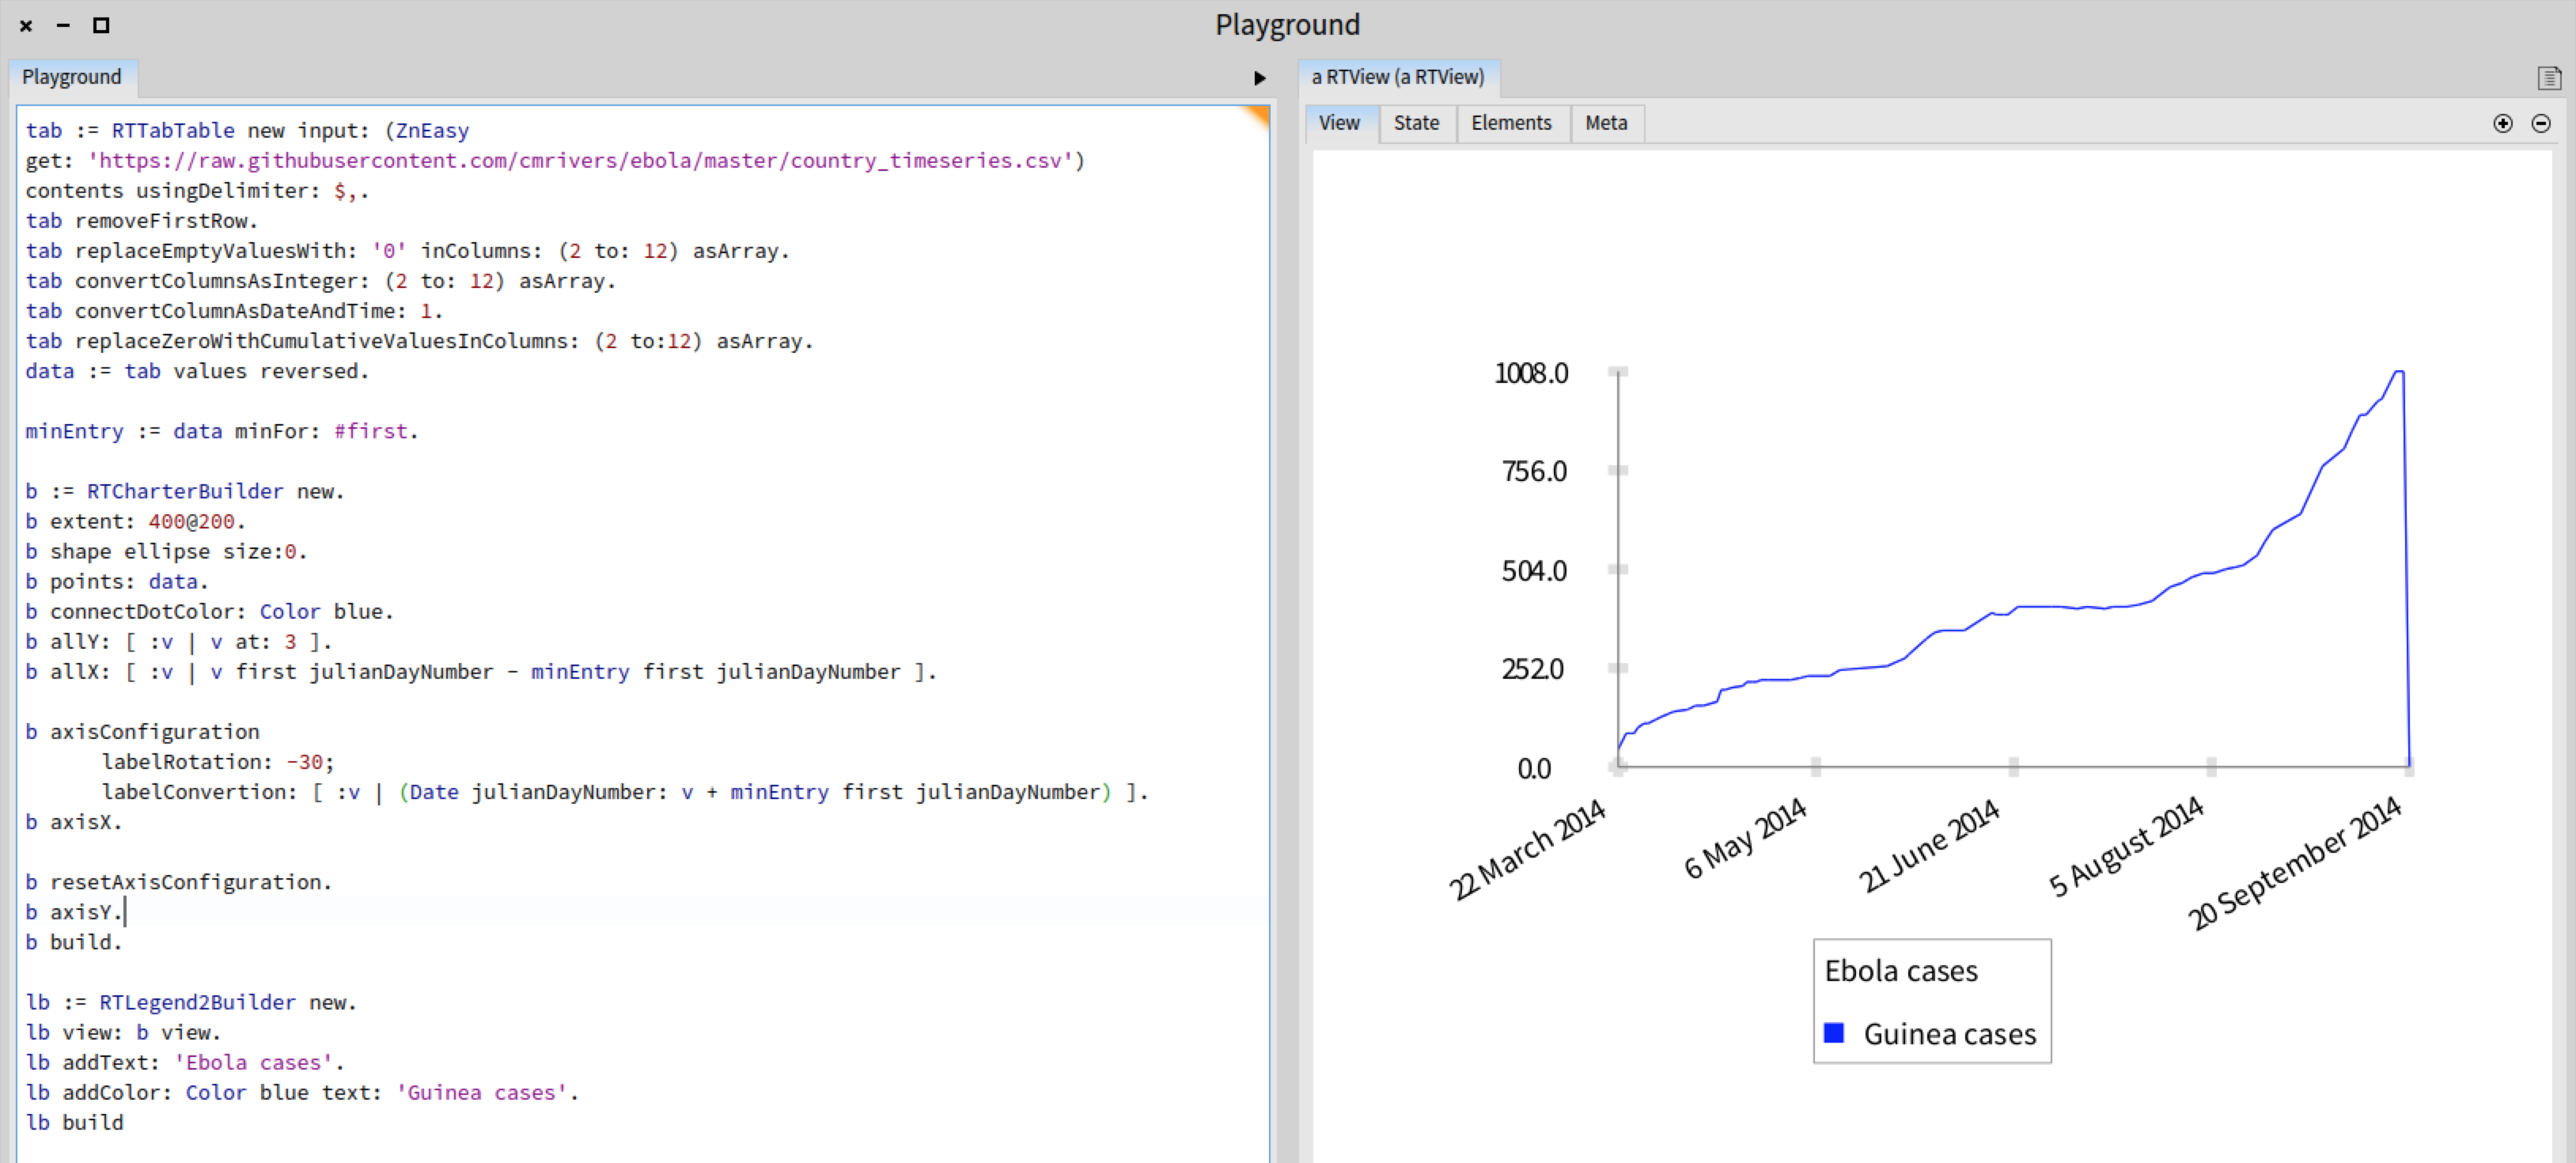
I was able to plot some nice Ebola cases very easily now:
================================================================ tab := RTTabTable new input: (ZnEasy get: ' https://raw.githubusercontent.com/cmrivers/ebola/master/country_timeseries.c... ') contents usingDelimiter: $,. tab removeFirstRow. tab replaceEmptyValuesWith: '0' inColumns: (2 to: 12) asArray. tab convertColumnsAsInteger: (2 to: 12) asArray. tab convertColumnAsDateAndTime: 1. tab replaceZeroWithCumulativeValuesInColumns: (2 to:12) asArray. data := tab values reversed.
minEntry := data minFor: #first.
b := RTCharterBuilder new. b extent: 400@200. b shape ellipse size:0. b points: data. b connectDotColor: Color blue. b allY: [ :v | v at: 3 ]. b allX: [ :v | v first julianDayNumber - minEntry first julianDayNumber ].
b axisConfiguration labelRotation: -30; labelConvertion: [ :v | (Date julianDayNumber: v + minEntry first julianDayNumber) ]. b axisX.
b resetAxisConfiguration. b axisY. b build.
lb := RTLegend2Builder new. lb view: b view. lb addText: 'Ebola cases'. lb addColor: Color blue text: 'Guinea cases'. lb build ================================================================
[image: Inline image 2]
On Mon, Sep 22, 2014 at 10:31 PM, Alexandre Bergel alexandre.bergel@me.com wrote:
Hi!
Here is a post that describe how to have dates on the X-axis. This has been a recurrent problem, which is why I would like to share it with you.
Dates are particular values that requires an adequate control over what is being displayed on X-axis. The julianDayNumber converts a date into a number.
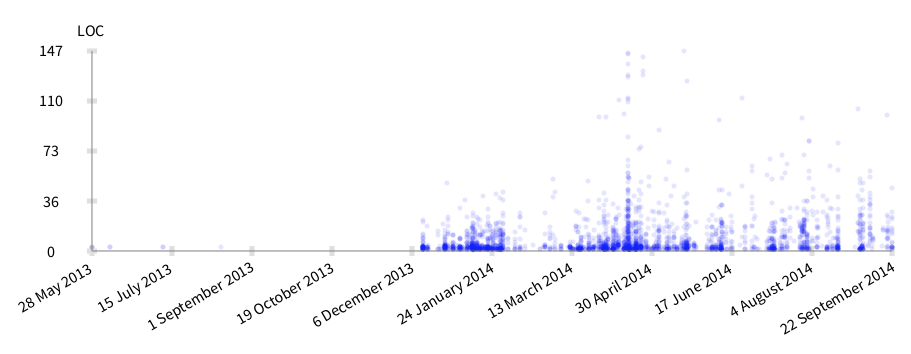
-=-=-=-=-=-=-=-=-=-=-=-=-=-=-=-=-=-=-=-= methods := RTObject withAllSubclasses flatCollect: #methods. methods := methods reject: [ :m | m numberOfLinesOfCode > 150 ]. oldestMethod := methods minFor: #date.
b := RTCharterBuilder new. b extent: 800 @ 200. b shape circle size: 5; color: (Color blue alpha: 0.1). b interaction popup. b points: methods. b allY: #numberOfLinesOfCode. b allX: [ :m | m date julianDayNumber - oldestMethod date julianDayNumber ].
b axisConfiguration noDecimals; title: 'LOC'. b axisY. b axisConfiguration title: ''; labelRotation: -30; numberOfTicks: 10; numberOfLabels: 10; labelConvertion: [ :v | (Date julianDayNumber: v + oldestMethod date julianDayNumber) ]. b axisX.
b build
Cheers, Alexandre -- _,.;:~^~:;._,.;:~^~:;._,.;:~^~:;._,.;:~^~:;._,.;: Alexandre Bergel http://www.bergel.eu ^~:;._,.;:~^~:;._,.;:~^~:;._,.;:~^~:;._,.;:~^~:;.
Moose-dev mailing list Moose-dev@iam.unibe.ch https://www.iam.unibe.ch/mailman/listinfo/moose-dev