
Hello,
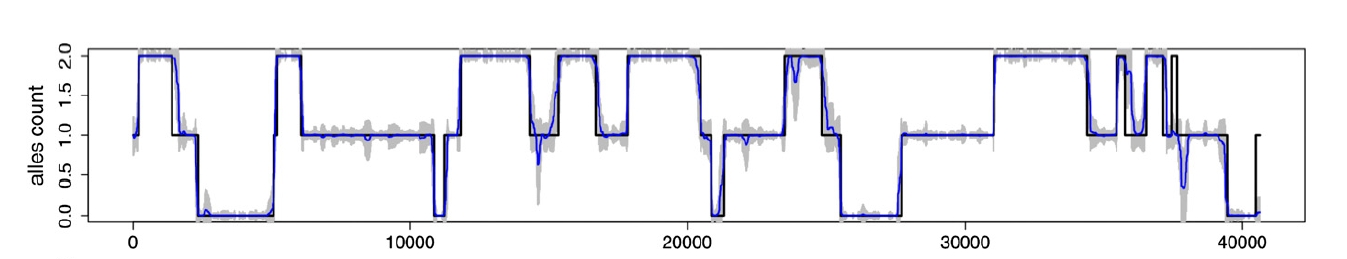
I am using Roassal2 (StephanEggermont.40) in Pharo 4. The attached picture displays a common visualization for inference of local ancestry in population genetics, I have attached what I am getting now with Grapher. Input data for such visualization is for example:
1:454 2:1488 1:2546 2:5711 1:14253 2:24411 1:31490 0:41585
(those are like Associations with key 0, 1 or 2 and value 454, 1488, ... etc)
In the attached picture
Min X is 0 and Max X is 41500
so the X axis (chromosome positions) is rendered in intervals between 10000.
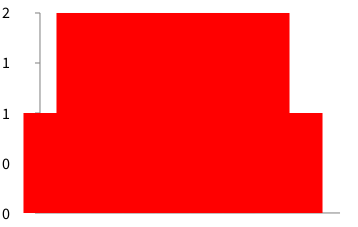
This is what I am trying now (code is commented where I tried to configure X axis interval)
| b intv |
intv := 0 to: 40000 by: 10000. b := RTGrapher new.
ds := RTStackedDataSet new. ds dotShape color: Color red. ds points: #(1 2 1 2 1 2 1 0); x: intv. "????" ds barShape width: 99; color: Color red. "b minX: 0; maxX: 41500." b add: ds. b axisX noLabel; noTick. b axisY noDecimal. b build.
I have some questions:
1) There is support to add an interval label to the X axis but preserving the space relation with the real chromosome position (the X axis) for the data (points in my example = 454 1488 2546 5711 14253 24411 31490 41585)?
2) How to clear the bar filling?
Any advice or help would be really nice.
Hernán