
Hi Alex,
Thank you for taking care of this issue. The problem is partially fixed. I saw you implemented
configureForBarCharts
self datasets do: #offsetForBarCharts. self minX: 0.5. self maxX: self getMaxNumberOfPoints. self axisX noTick.
However, I want to display the ticks, so I borrowed the first 3 lines for my plot method :
plotHistogramBins: binNumber xAxisLabel: axisXLabel yAxisLabel:
axixYLabel color: aColor barWidth: barWidth
| bins minPoint g ds |
bins := self groupedBySeqLengthDistribution: binNumber. minPoint := ((bins reject: #isEmpty) detectMin: #size) anyOne size.
" Build diagram " g := RTGrapher new extent: 500 @ 200; minX: minPoint; withoutOrigin; yourself. ds := RTData new points: bins; x: [ : c | c ifEmpty: [ minPoint ] ifNotEmpty: [ : d | d anyOne size ] ]; y: #size. ds barShape borderColor: Color black; color: aColor; width: barWidth. g add: ds.
" Configure axis settings " g axisY title: axixYLabel; color: Color black; noDecimal. g axisX noDecimal; fromPoint: minPoint; color: Color black; title: axisXLabel.
g datasets do: #offsetForBarCharts. g minX: 0. g maxX: g getMaxNumberOfPoints.
" Open visualization in a new window " g open.
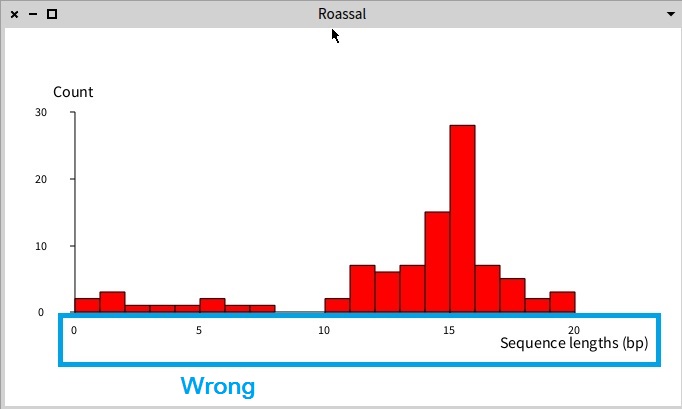
Now the shift problem is fixed, but I lost the sequence lengths in the X axis. Please see the two attached screenshots.
Cheers,
Hernán
2017-07-09 5:20 GMT-03:00 Alexandre Bergel alexandre.bergel@me.com:
Hi Hernán,
Sorry to reply to late.
Can you update Roassal and try:
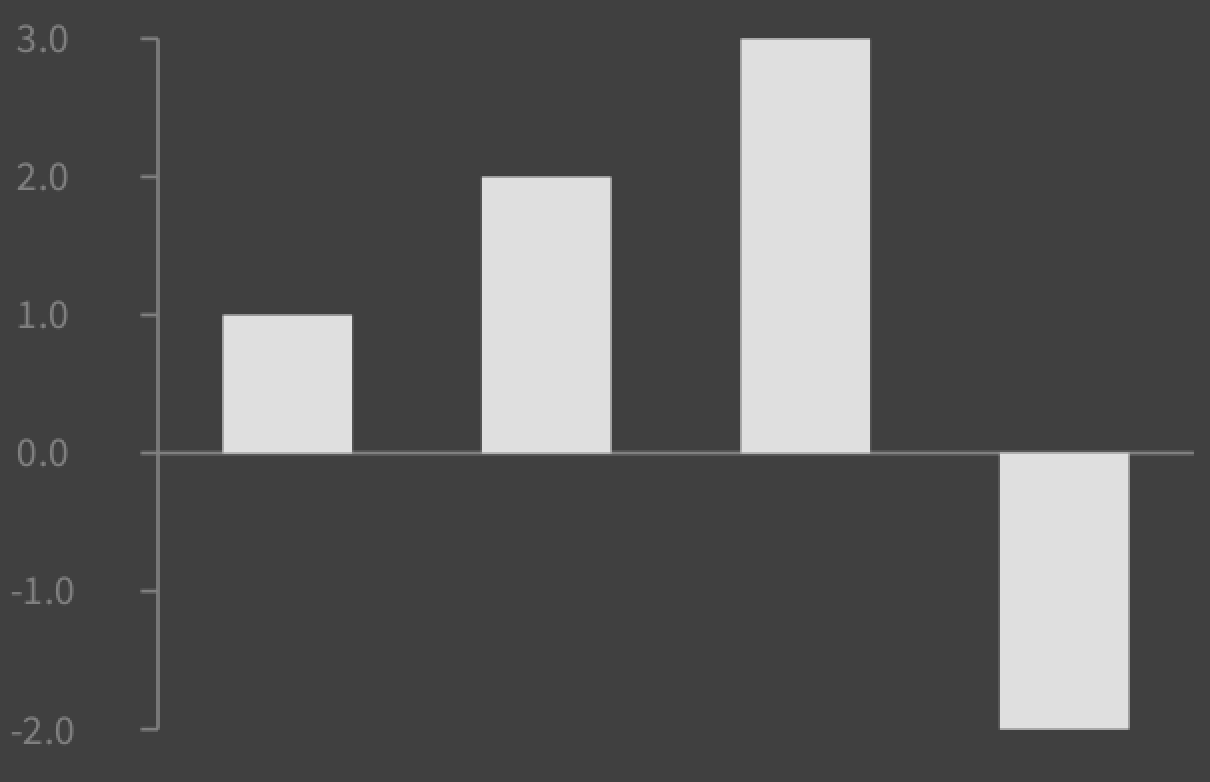
-=-=-=-=-=-=-=-=-= g := RTGrapher new.
ds := RTData new. ds barShape. ds points: #(1 2 3 -2). ds maxX: 10. g add: ds.
g configureForBarCharts.
g
The call configureforBarCharts should do what you expect.
Cheers, Alexandre
-- _,.;:~^~:;._,.;:~^~:;._,.;:~^~:;._,.;:~^~:;._,.;: Alexandre Bergel http://www.bergel.eu ^~:;._,.;:~^~:;._,.;:~^~:;._,.;:~^~:;._,.;:~^~:;.
On Jun 16, 2017, at 4:35 PM, Hernán Morales Durand < hernan.morales@gmail.com> wrote:
Hi Alex
I attached another screenshot which describes exactly the problem.
2017-06-16 10:40 GMT-03:00 Alexandre Bergel alexandre.bergel@me.com: Hi Hernán,
I am not sure what exactly is the problematic situation you describe. Why you cannot simply with with #minX: and #maxX: ?
My script actually sets minX: but it is wrongly drawn in the histogram
For example, I tried to reuse the code you have provided. I can have:
bins := #(#(1 1 1 1 ) #(2 2 2) #(5 5 5 5 5)).
minPoint := ((bins reject: #isEmpty) detectMin: [ : c | c size ])
anyOne.
" Build diagram "
g := RTGrapher new
        extent: 500 @ 200;
        minX: 0;
maxX: 6; withoutOrigin; yourself. ds := RTData new points: bins; x: [ : c | c ifEmpty: [ minPoint ] ifNotEmpty: [ : d | d anyOne ] ]; y: #size. ds barShape borderColor: Color black; color: Color red trans; width: 30. g add: ds.
g<Screenshot 2017-06-16 09.39.25.png>
But you can have "minX: 1", which in that case, the first bar is above the Y-Axis. This is what one would expect.
The problem is not positioning the bars above the Y-Axis, but positioning them in the X-Axis.
Which rendering do you wish to have? Can you provide a self-contained piece of code that I can run on my machine?
If you have some time you could install BioSmalltalk in Pharo 5 (I haven't tested Pharo 6 yet) and evaluate the problematic expression: Metacello new smalltalkhubUser: 'hernan' project: 'BioSmalltalk'; configuration: 'BioSmalltalk'; version: #bleedingEdge; load
(BioParser parseMultiFastaFile: BioObject testFilesDirectoryName asFileReference / 'ls_orchid.fasta') plotHistogramBins: 20 xAxisLabel: 'Sequence lengths (bp)' yAxisLabel: 'Count' color: Color red
Cheers,
Hernán
Cheers, Alexandre -- _,.;:~^~:;._,.;:~^~:;._,.;:~^~:;._,.;:~^~:;._,.;: Alexandre Bergel http://www.bergel.eu ^~:;._,.;:~^~:;._,.;:~^~:;._,.;:~^~:;._,.;:~^~:;.
On Jun 15, 2017, at 1:16 AM, Hernán Morales Durand < hernan.morales@gmail.com> wrote:
Hi guys,
I am experiencing a problem visualizing histograms in Roassal with Pharo 5. In the attached image you can observe the first bar shape starts from a negative X axis value, where I want to start from 0. Besides, some bars are gapped but I don't know why.
I am using with the following code:
| bins minPoint g ds |

bins := self groupedBySeqLengthDistribution: binNumber.
minPoint := ((bins reject: #isEmpty) detectMin: [ : c | c size ])
anyOne size.
" Build diagram "
g := RTGrapher new
        extent: 500 @ 200;
        minX: minPoint;
        withoutOrigin;
        yourself.
ds := RTData new
    points: bins;
    x: [ : c | c ifEmpty: [ minPoint ] ifNotEmpty: [ : d | d anyOne
size ] ]; y: #size. ds barShape borderColor: Color black; color: aColor; width: barWidth. g add: ds.
" Configure axis settings "
g axisY
    title: axixYLabel;
    color: Color black;
    noDecimal.
g axisX
    noDecimal;
    fromPoint: minPoint;
    color: Color black;
    title: axisXLabel.
" Open visualization in a new window "
g open.
Any idea what I am missing?
Cheers,
Hernán <Roassal.jpeg>_______________________________________________ Moose-dev mailing list Moose-dev@list.inf.unibe.ch https://www.list.inf.unibe.ch/listinfo/moose-dev
Moose-dev mailing list Moose-dev@list.inf.unibe.ch https://www.list.inf.unibe.ch/listinfo/moose-dev
<unnamed.jpg>_______________________________________________ Moose-dev mailing list Moose-dev@list.inf.unibe.ch https://www.list.inf.unibe.ch/listinfo/moose-dev
Moose-dev mailing list Moose-dev@list.inf.unibe.ch https://www.list.inf.unibe.ch/listinfo/moose-dev