
Hi,
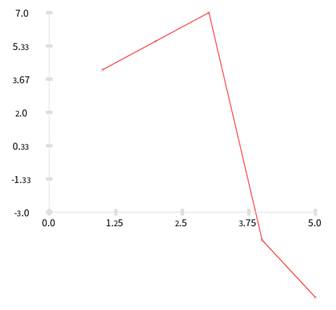
I currently use Charter which is doing nice charts for me. But I experienced some kind of bug with the scales of the chart especially if the values are negatives. See by yourself: [cid:image001.jpg@01CFB315.9897E410] Here the code to draw it: | b | b := RTCharterBuilder new. b extent: 400 @ 300. b points: { 5 . 6 . 7 .-1 . -3}. b connectDotColor: Color red. b interaction popup. b allY: #yourself. b stackX. b axisXWithNumberOfTicks: 4. b axisYWithNumberOfTicks: 6. b open. b view canvas.
Did I make something wrong?
Thanks in advance !
Cheers,
Vincent
________________________________
Ce message et les pi?ces jointes sont confidentiels et r?serv?s ? l'usage exclusif de ses destinataires. Il peut ?galement ?tre prot?g? par le secret professionnel. Si vous recevez ce message par erreur, merci d'en avertir imm?diatement l'exp?diteur et de le d?truire. L'int?grit? du message ne pouvant ?tre assur?e sur Internet, la responsabilit? de Worldline ne pourra ?tre recherch?e quant au contenu de ce message. Bien que les meilleurs efforts soient faits pour maintenir cette transmission exempte de tout virus, l'exp?diteur ne donne aucune garantie ? cet ?gard et sa responsabilit? ne saurait ?tre recherch?e pour tout dommage r?sultant d'un virus transmis.
This e-mail and the documents attached are confidential and intended solely for the addressee; it may also be privileged. If you receive this e-mail in error, please notify the sender immediately and destroy it. As its integrity cannot be secured on the Internet, the Worldline liability cannot be triggered for the message content. Although the sender endeavours to maintain a computer virus-free network, the sender does not warrant that this transmission is virus-free and will not be liable for any damages resulting from any virus transmitted.

Charter is still in development. Negative values are absolutely not handled so far. However, this is not a big deal to fix. I will work in it today.
Alexandre
Le 08-08-2014 à 8:32, Blondeau Vincent vincent.blondeau@worldline.com a écrit :
Hi,
I currently use Charter which is doing nice charts for me. But I experienced some kind of bug with the scales of the chart especially if the values are negatives. See by yourself: <image001.jpg> Here the code to draw it: | b | b := RTCharterBuilder new. b extent: 400 @ 300. b points: { 5 . 6 . 7 .-1 . -3}. b connectDotColor: Color red. b interaction popup. b allY: #yourself. b stackX. b axisXWithNumberOfTicks: 4. b axisYWithNumberOfTicks: 6. b open. b view canvas.
Did I make something wrong?
Thanks in advance !
Cheers,
Vincent
Ce message et les pièces jointes sont confidentiels et réservés à l'usage exclusif de ses destinataires. Il peut également être protégé par le secret professionnel. Si vous recevez ce message par erreur, merci d'en avertir immédiatement l'expéditeur et de le détruire. L'intégrité du message ne pouvant être assurée sur Internet, la responsabilité de Worldline ne pourra être recherchée quant au contenu de ce message. Bien que les meilleurs efforts soient faits pour maintenir cette transmission exempte de tout virus, l'expéditeur ne donne aucune garantie à cet égard et sa responsabilité ne saurait être recherchée pour tout dommage résultant d'un virus transmis.
This e-mail and the documents attached are confidential and intended solely for the addressee; it may also be privileged. If you receive this e-mail in error, please notify the sender immediately and destroy it. As its integrity cannot be secured on the Internet, the Worldline liability cannot be triggered for the message content. Although the sender endeavours to maintain a computer virus-free network, the sender does not warrant that this transmission is virus-free and will not be liable for any damages resulting from any virus transmitted. _______________________________________________ Moose-dev mailing list Moose-dev@iam.unibe.ch https://www.iam.unibe.ch/mailman/listinfo/moose-dev
Hi Vincent,
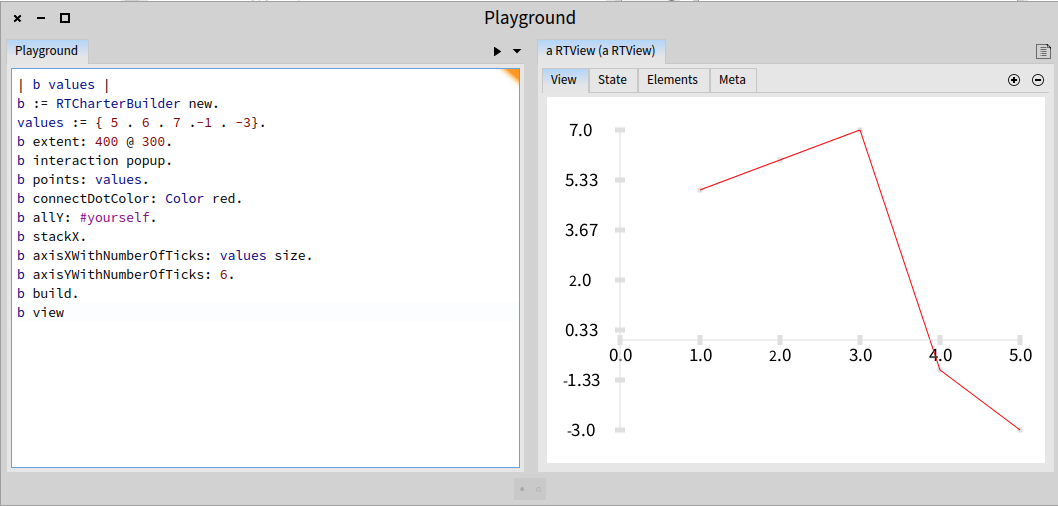
Your script was okay. Charter was just buggy. -=-=-=-=-=-=-=-=-=-=-=-= | b values | b := RTCharterBuilder new. values := { 5 . 6 . 7 .-1 . -3}. b extent: 400 @ 300. b interaction popup. b points: values. b connectDotColor: Color red. b allY: #yourself. b stackX. b axisXWithNumberOfTicks: values size. b axisYWithNumberOfTicks: 6. b build. b view -=-=-=-=-=-=-=-=-=-=-=-=
Here is a slightly different version of your script (the definition of the interaction is __before__ adding the points).
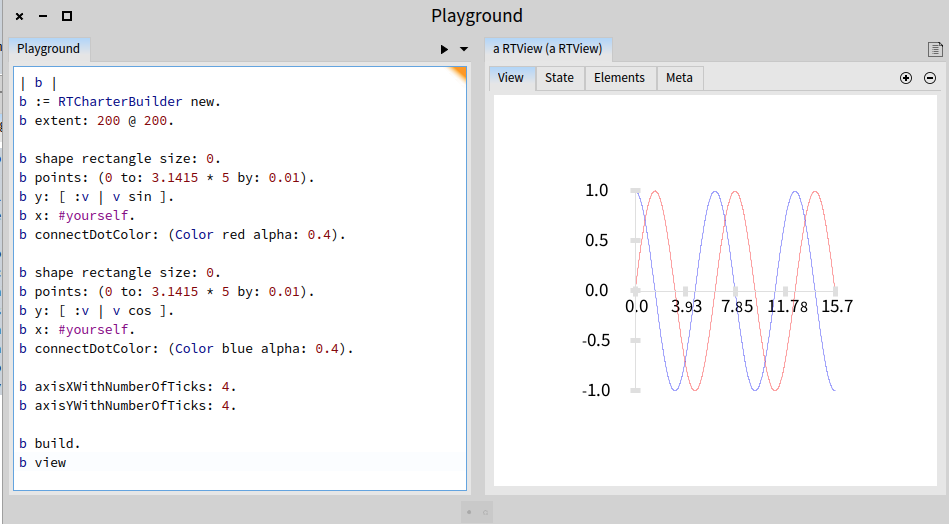
Another example
Currently, x values _cannot_ be negative. It is not complicated to do (if you need this, and if you have time, then go ahead :-), but I need a bit more time.
Let me this if this version solves your immediate problems. And please, shout if something does not work for you (as you did :-)
Cheers, Alexandre

Blondeau Vincent wrote
I experienced some kind of bug with the scales of the chart...
Maybe related? The following script starts the first x value way off to the right, even though I thought #stackX just uses 1, 2, 3... ============ data := { { Date yesterday. '3' }. { Date today. '30' } }.
"Charting the data" b := RTCharterBuilder new. b extent: 500 @ 400. b interaction popupText: [ :row | row date julianDayNumber ]. b points: data. b connectDotColor: Color green. b allY: [ :r | r second asNumber ]. b allX: [ :d | d first julianDayNumber ]. b stackX. b axisY. b build. b view. ============ 3 tested scenarios: - #stackX and then #axisX - the two x values span from about 3.0 - 4.0, with the axis labeled only from 0.0 to 2.0. - #axisX and then #stackX - the labels are up to the first date point x value, but the point itself is still shifted more to the right - only #stackX - no labels, but first point shifted way to right from origin
Then as a sanity check, I manually put -43000 into the first x data point, with only #stackX and it still showed the first point to the right of the origin.
----- Cheers, Sean -- View this message in context: http://forum.world.st/Charter-axes-scale-tp4772485p4773884.html Sent from the Moose mailing list archive at Nabble.com.
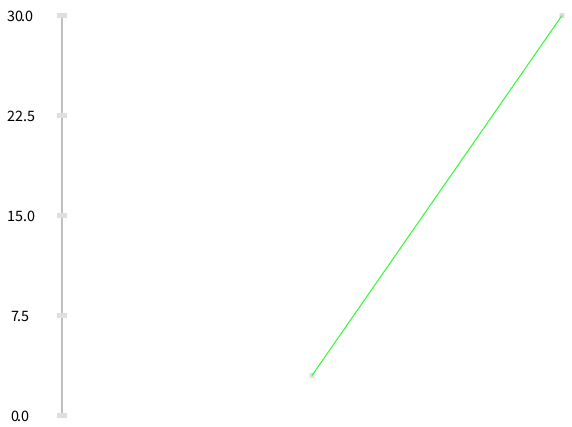
Sean, if you want to stack from left to right your data points, why do you use allX: ? If you remove the line allX: in your example, then you end up with:
Is this what you expect?
Cheers, Alexandre
-
 Alexandre Bergel
 -
 Blondeau Vincent
 -
 Sean P. DeNigris