
Hi all, I want to draw curved lines in Roassal but I can't find how to. The image below is an example of what I am trying to do.
http://www.aboutbookbinding.com/images/Lines-made-with-Gouges.jpg
Bests, Miguel

Try with RTArc:
view := RTView new. shape := RTArc new innerRadius: [ :i | i *15]; externalRadius: [ :i | (i * 15) + 4]; alphaAngle: 45; betaAngle: 135; color: Color black. view addAll: (shape elementsOn: (1 to: 11) ).
view
Cheers, Milton
2015-05-14 16:26 GMT-04:00 Miguel Campusano mcampusa@dcc.uchile.cl:
Hi all, I want to draw curved lines in Roassal but I can't find how to. The image below is an example of what I am trying to do.
http://www.aboutbookbinding.com/images/Lines-made-with-Gouges.jpg
Bests, Miguel
Moose-dev mailing list Moose-dev@iam.unibe.ch https://www.iam.unibe.ch/mailman/listinfo/moose-dev

You can also use bezier lines or SVG
~~~~~~~~~~~~~~~~~~~~~~~~~~~~~~~~~~~~ | v e1 e2 l s p1 p2 path svg| v := RTView new.
path := 'M -150 150 Q -75 150 -75 75 Q -75 0 0 0'. svg := RTSVGPath new borderColor: Color red; path: path; element. v add: svg.
^ v ~~~~~~~~~~~~~~~~~~~~~~~~~~~~~~~~~~~~
Peter
On Thu, May 14, 2015 at 10:36 PM, milton mamani akevalion@gmail.com wrote:
Try with RTArc:
view := RTView new. shape := RTArc new innerRadius: [ :i | i *15]; externalRadius: [ :i | (i * 15) + 4]; alphaAngle: 45; betaAngle: 135; color: Color black. view addAll: (shape elementsOn: (1 to: 11) ).
view
Cheers, Milton
2015-05-14 16:26 GMT-04:00 Miguel Campusano mcampusa@dcc.uchile.cl:
Hi all, I want to draw curved lines in Roassal but I can't find how to. The image below is an example of what I am trying to do.
http://www.aboutbookbinding.com/images/Lines-made-with-Gouges.jpg
Bests, Miguel
Moose-dev mailing list Moose-dev@iam.unibe.ch https://www.iam.unibe.ch/mailman/listinfo/moose-dev
Moose-dev mailing list Moose-dev@iam.unibe.ch https://www.iam.unibe.ch/mailman/listinfo/moose-dev
Thanks! Both seem to work fine, I'm going to play a bit before deciding for one :)
On Thu, May 14, 2015 at 5:44 PM Peter Uhnák i.uhnak@gmail.com wrote:
You can also use bezier lines or SVG
| v e1 e2 l s p1 p2 path svg|
v := RTView new.

path := 'M -150 150 Q -75 150 -75 75 Q -75 0 0 0'.
svg := RTSVGPath new borderColor: Color red; path: path; element.
v add: svg.

^ v
Peter
On Thu, May 14, 2015 at 10:36 PM, milton mamani akevalion@gmail.com wrote:
Try with RTArc:
view := RTView new. shape := RTArc new innerRadius: [ :i | i *15]; externalRadius: [ :i | (i * 15) + 4]; alphaAngle: 45; betaAngle: 135; color: Color black. view addAll: (shape elementsOn: (1 to: 11) ).
view
Cheers, Milton
2015-05-14 16:26 GMT-04:00 Miguel Campusano mcampusa@dcc.uchile.cl:
Hi all, I want to draw curved lines in Roassal but I can't find how to. The image below is an example of what I am trying to do.
http://www.aboutbookbinding.com/images/Lines-made-with-Gouges.jpg
Bests, Miguel
Moose-dev mailing list Moose-dev@iam.unibe.ch https://www.iam.unibe.ch/mailman/listinfo/moose-dev
Moose-dev mailing list Moose-dev@iam.unibe.ch https://www.iam.unibe.ch/mailman/listinfo/moose-dev
Moose-dev mailing list Moose-dev@iam.unibe.ch https://www.iam.unibe.ch/mailman/listinfo/moose-dev

Ok, let us know! And send us screenshots :-)
Alexandre
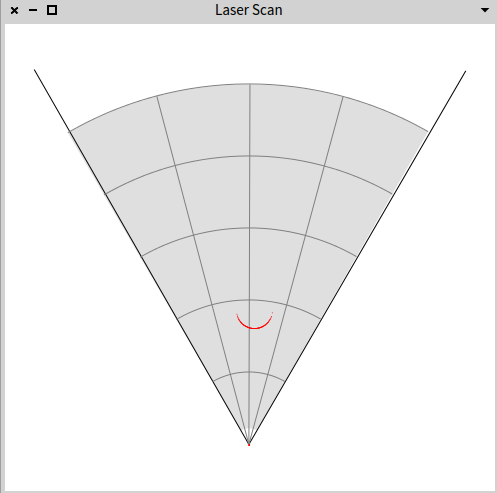
Here is the screenshot, it is a visualization from the data captured from a laser scan sensor from a robot. The visualization shows an object with the red line and a grid to understand quickly the position of the object within the range of the sensor (This case, the object is approximately in the center between 2 to 4 meters from the robot) . The visualization is dynamic, ie: the red line is automatically updated overtime ;)
On Fri, May 15, 2015 at 12:33 PM Alexandre Bergel alexandre.bergel@me.com wrote:
Ok, let us know! And send us screenshots :-)
Alexandre
_,.;:~^~:;._,.;:~^~:;._,.;:~^~:;._,.;:~^~:;._,.;: Alexandre Bergel http://www.bergel.eu ^~:;._,.;:~^~:;._,.;:~^~:;._,.;:~^~:;._,.;:~^~:;.
On May 15, 2015, at 10:56 AM, Miguel Campusano mcampusa@dcc.uchile.cl wrote:
Thanks! Both seem to work fine, I'm going to play a bit before deciding for one :)
On Thu, May 14, 2015 at 5:44 PM Peter Uhnák i.uhnak@gmail.com wrote:
You can also use bezier lines or SVG
| v e1 e2 l s p1 p2 path svg|
v := RTView new.

path := 'M -150 150 Q -75 150 -75 75 Q -75 0 0 0'.
svg := RTSVGPath new borderColor: Color red; path: path; element.
v add: svg.

^ v
Peter
On Thu, May 14, 2015 at 10:36 PM, milton mamani akevalion@gmail.com wrote:
Try with RTArc:
view := RTView new. shape := RTArc new innerRadius: [ :i | i *15]; externalRadius: [ :i | (i * 15) + 4]; alphaAngle: 45; betaAngle: 135; color: Color black. view addAll: (shape elementsOn: (1 to: 11) ).
view
Cheers, Milton
2015-05-14 16:26 GMT-04:00 Miguel Campusano mcampusa@dcc.uchile.cl:
Hi all, I want to draw curved lines in Roassal but I can't find how to. The image below is an example of what I am trying to do.
http://www.aboutbookbinding.com/images/Lines-made-with-Gouges.jpg
Bests, Miguel
Moose-dev mailing list Moose-dev@iam.unibe.ch https://www.iam.unibe.ch/mailman/listinfo/moose-dev
Moose-dev mailing list Moose-dev@iam.unibe.ch https://www.iam.unibe.ch/mailman/listinfo/moose-dev
Moose-dev mailing list Moose-dev@iam.unibe.ch https://www.iam.unibe.ch/mailman/listinfo/moose-dev
Moose-dev mailing list Moose-dev@iam.unibe.ch https://www.iam.unibe.ch/mailman/listinfo/moose-dev
Moose-dev mailing list Moose-dev@iam.unibe.ch https://www.iam.unibe.ch/mailman/listinfo/moose-dev

Nice :)
Could you send a video? :)
Doru
On Mon, May 18, 2015 at 8:56 PM, Miguel Campusano mcampusa@dcc.uchile.cl wrote:
Here is the screenshot, it is a visualization from the data captured from a laser scan sensor from a robot. The visualization shows an object with the red line and a grid to understand quickly the position of the object within the range of the sensor (This case, the object is approximately in the center between 2 to 4 meters from the robot) . The visualization is dynamic, ie: the red line is automatically updated overtime ;)
On Fri, May 15, 2015 at 12:33 PM Alexandre Bergel alexandre.bergel@me.com wrote:
Ok, let us know! And send us screenshots :-)
Alexandre
_,.;:~^~:;._,.;:~^~:;._,.;:~^~:;._,.;:~^~:;._,.;: Alexandre Bergel http://www.bergel.eu ^~:;._,.;:~^~:;._,.;:~^~:;._,.;:~^~:;._,.;:~^~:;.
On May 15, 2015, at 10:56 AM, Miguel Campusano mcampusa@dcc.uchile.cl wrote:
Thanks! Both seem to work fine, I'm going to play a bit before deciding for one :)
On Thu, May 14, 2015 at 5:44 PM Peter Uhnák i.uhnak@gmail.com wrote:
You can also use bezier lines or SVG
| v e1 e2 l s p1 p2 path svg|
v := RTView new.

path := 'M -150 150 Q -75 150 -75 75 Q -75 0 0 0'.
svg := RTSVGPath new borderColor: Color red; path: path; element.
v add: svg.

^ v
Peter
On Thu, May 14, 2015 at 10:36 PM, milton mamani akevalion@gmail.com wrote:
Try with RTArc:
view := RTView new. shape := RTArc new innerRadius: [ :i | i *15]; externalRadius: [ :i | (i * 15) + 4]; alphaAngle: 45; betaAngle: 135; color: Color black. view addAll: (shape elementsOn: (1 to: 11) ).
view
Cheers, Milton
2015-05-14 16:26 GMT-04:00 Miguel Campusano mcampusa@dcc.uchile.cl:
Hi all, I want to draw curved lines in Roassal but I can't find how to. The image below is an example of what I am trying to do.
http://www.aboutbookbinding.com/images/Lines-made-with-Gouges.jpg
Bests, Miguel
Moose-dev mailing list Moose-dev@iam.unibe.ch https://www.iam.unibe.ch/mailman/listinfo/moose-dev
Moose-dev mailing list Moose-dev@iam.unibe.ch https://www.iam.unibe.ch/mailman/listinfo/moose-dev
Moose-dev mailing list Moose-dev@iam.unibe.ch https://www.iam.unibe.ch/mailman/listinfo/moose-dev
Moose-dev mailing list Moose-dev@iam.unibe.ch https://www.iam.unibe.ch/mailman/listinfo/moose-dev
Moose-dev mailing list Moose-dev@iam.unibe.ch https://www.iam.unibe.ch/mailman/listinfo/moose-dev
Moose-dev mailing list Moose-dev@iam.unibe.ch https://www.iam.unibe.ch/mailman/listinfo/moose-dev
I want to add labels first, after that I'm going to publish a video. :)
On Mon, May 18, 2015 at 4:52 PM Tudor Girba tudor@tudorgirba.com wrote:
Nice :)
Could you send a video? :)
Doru
On Mon, May 18, 2015 at 8:56 PM, Miguel Campusano mcampusa@dcc.uchile.cl wrote:
Here is the screenshot, it is a visualization from the data captured from a laser scan sensor from a robot. The visualization shows an object with the red line and a grid to understand quickly the position of the object within the range of the sensor (This case, the object is approximately in the center between 2 to 4 meters from the robot) . The visualization is dynamic, ie: the red line is automatically updated overtime ;)
On Fri, May 15, 2015 at 12:33 PM Alexandre Bergel < alexandre.bergel@me.com> wrote:
Ok, let us know! And send us screenshots :-)
Alexandre
_,.;:~^~:;._,.;:~^~:;._,.;:~^~:;._,.;:~^~:;._,.;: Alexandre Bergel http://www.bergel.eu ^~:;._,.;:~^~:;._,.;:~^~:;._,.;:~^~:;._,.;:~^~:;.
On May 15, 2015, at 10:56 AM, Miguel Campusano mcampusa@dcc.uchile.cl wrote:
Thanks! Both seem to work fine, I'm going to play a bit before deciding for one :)
On Thu, May 14, 2015 at 5:44 PM Peter Uhnák i.uhnak@gmail.com wrote:
You can also use bezier lines or SVG
| v e1 e2 l s p1 p2 path svg|
v := RTView new.

path := 'M -150 150 Q -75 150 -75 75 Q -75 0 0 0'.
svg := RTSVGPath new borderColor: Color red; path: path; element.
v add: svg.

^ v
Peter
On Thu, May 14, 2015 at 10:36 PM, milton mamani akevalion@gmail.com wrote:
Try with RTArc:
view := RTView new. shape := RTArc new innerRadius: [ :i | i *15]; externalRadius: [ :i | (i * 15) + 4]; alphaAngle: 45; betaAngle: 135; color: Color black. view addAll: (shape elementsOn: (1 to: 11) ).
view
Cheers, Milton
2015-05-14 16:26 GMT-04:00 Miguel Campusano mcampusa@dcc.uchile.cl:
Hi all, I want to draw curved lines in Roassal but I can't find how to. The image below is an example of what I am trying to do.
http://www.aboutbookbinding.com/images/Lines-made-with-Gouges.jpg
Bests, Miguel
Moose-dev mailing list Moose-dev@iam.unibe.ch https://www.iam.unibe.ch/mailman/listinfo/moose-dev
Moose-dev mailing list Moose-dev@iam.unibe.ch https://www.iam.unibe.ch/mailman/listinfo/moose-dev
Moose-dev mailing list Moose-dev@iam.unibe.ch https://www.iam.unibe.ch/mailman/listinfo/moose-dev
Moose-dev mailing list Moose-dev@iam.unibe.ch https://www.iam.unibe.ch/mailman/listinfo/moose-dev
Moose-dev mailing list Moose-dev@iam.unibe.ch https://www.iam.unibe.ch/mailman/listinfo/moose-dev
Moose-dev mailing list Moose-dev@iam.unibe.ch https://www.iam.unibe.ch/mailman/listinfo/moose-dev
-- www.tudorgirba.com
"Every thing has its own flow" _______________________________________________ Moose-dev mailing list Moose-dev@iam.unibe.ch https://www.iam.unibe.ch/mailman/listinfo/moose-dev
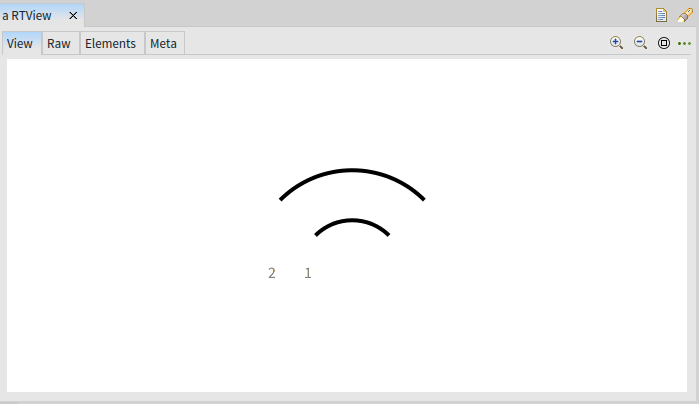
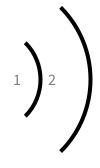
Following this, I tried to add labels to the arcs but It is not working as I expected. My code:
view := RTView new. shape := RTArc new innerRadius: [ :i | i *50]; externalRadius: [ :i | (i * 50) + 4]; alphaAngle: 45; betaAngle: 135; color: Color black. elems := shape elementsOn: (1 to: 2). view addAll: elems.
label := RTLabelled new text: #yourself. label left. elems @ label.
view
and the results is the attached image.
I want the labels to be at the left of the arc line. Maybe I'm doing something wrong? any ideas?
Bests, Miguel
On Mon, May 18, 2015 at 5:02 PM Miguel Campusano mcampusa@dcc.uchile.cl wrote:
I want to add labels first, after that I'm going to publish a video. :)
On Mon, May 18, 2015 at 4:52 PM Tudor Girba tudor@tudorgirba.com wrote:
Nice :)
Could you send a video? :)
Doru
On Mon, May 18, 2015 at 8:56 PM, Miguel Campusano <mcampusa@dcc.uchile.cl
wrote:
Here is the screenshot, it is a visualization from the data captured from a laser scan sensor from a robot. The visualization shows an object with the red line and a grid to understand quickly the position of the object within the range of the sensor (This case, the object is approximately in the center between 2 to 4 meters from the robot) . The visualization is dynamic, ie: the red line is automatically updated overtime ;)
On Fri, May 15, 2015 at 12:33 PM Alexandre Bergel < alexandre.bergel@me.com> wrote:
Ok, let us know! And send us screenshots :-)
Alexandre
_,.;:~^~:;._,.;:~^~:;._,.;:~^~:;._,.;:~^~:;._,.;: Alexandre Bergel http://www.bergel.eu ^~:;._,.;:~^~:;._,.;:~^~:;._,.;:~^~:;._,.;:~^~:;.
On May 15, 2015, at 10:56 AM, Miguel Campusano mcampusa@dcc.uchile.cl wrote:
Thanks! Both seem to work fine, I'm going to play a bit before deciding for one :)
On Thu, May 14, 2015 at 5:44 PM Peter Uhnák i.uhnak@gmail.com wrote:
You can also use bezier lines or SVG
| v e1 e2 l s p1 p2 path svg|
v := RTView new.

path := 'M -150 150 Q -75 150 -75 75 Q -75 0 0 0'.
svg := RTSVGPath new borderColor: Color red; path: path; element.
v add: svg.

^ v
Peter
On Thu, May 14, 2015 at 10:36 PM, milton mamani akevalion@gmail.com wrote:
Try with RTArc:
view := RTView new. shape := RTArc new innerRadius: [ :i | i *15]; externalRadius: [ :i | (i * 15) + 4]; alphaAngle: 45; betaAngle: 135; color: Color black. view addAll: (shape elementsOn: (1 to: 11) ).
view
Cheers, Milton
2015-05-14 16:26 GMT-04:00 Miguel Campusano mcampusa@dcc.uchile.cl:
> Hi all, > I want to draw curved lines in Roassal but I can't find how to. > The image below is an example of what I am trying to do. > > http://www.aboutbookbinding.com/images/Lines-made-with-Gouges.jpg > > Bests, > Miguel > > _______________________________________________ > Moose-dev mailing list > Moose-dev@iam.unibe.ch > https://www.iam.unibe.ch/mailman/listinfo/moose-dev > >
Moose-dev mailing list Moose-dev@iam.unibe.ch https://www.iam.unibe.ch/mailman/listinfo/moose-dev
Moose-dev mailing list Moose-dev@iam.unibe.ch https://www.iam.unibe.ch/mailman/listinfo/moose-dev
Moose-dev mailing list Moose-dev@iam.unibe.ch https://www.iam.unibe.ch/mailman/listinfo/moose-dev
Moose-dev mailing list Moose-dev@iam.unibe.ch https://www.iam.unibe.ch/mailman/listinfo/moose-dev
Moose-dev mailing list Moose-dev@iam.unibe.ch https://www.iam.unibe.ch/mailman/listinfo/moose-dev
-- www.tudorgirba.com
"Every thing has its own flow" _______________________________________________ Moose-dev mailing list Moose-dev@iam.unibe.ch https://www.iam.unibe.ch/mailman/listinfo/moose-dev
Hi
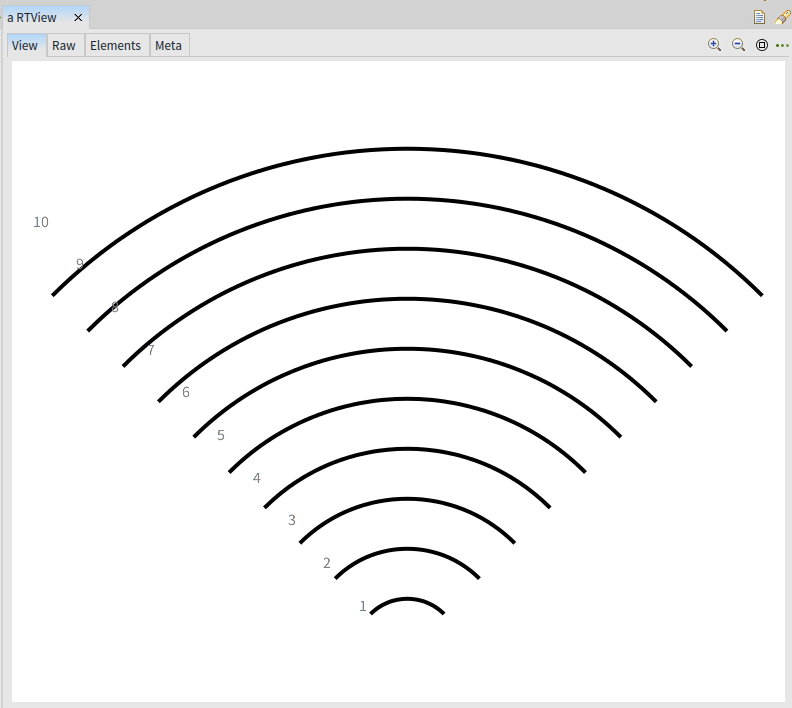
There was a problem in #encompassingRectangle in TRArcShape, try again with the last version of Roassal
[image: Imágenes integradas 1]
Cheers, Milton
2015-05-20 13:51 GMT-04:00 Miguel Campusano mcampusa@dcc.uchile.cl:
Following this, I tried to add labels to the arcs but It is not working as I expected. My code:
view := RTView new. shape := RTArc new innerRadius: [ :i | i *50]; externalRadius: [ :i | (i * 50) + 4]; alphaAngle: 45; betaAngle: 135; color: Color black. elems := shape elementsOn: (1 to: 2). view addAll: elems.
label := RTLabelled new text: #yourself. label left. elems @ label.
view
and the results is the attached image.
I want the labels to be at the left of the arc line. Maybe I'm doing something wrong? any ideas?
Bests, Miguel
On Mon, May 18, 2015 at 5:02 PM Miguel Campusano mcampusa@dcc.uchile.cl wrote:
I want to add labels first, after that I'm going to publish a video. :)
On Mon, May 18, 2015 at 4:52 PM Tudor Girba tudor@tudorgirba.com wrote:
Nice :)
Could you send a video? :)
Doru
On Mon, May 18, 2015 at 8:56 PM, Miguel Campusano < mcampusa@dcc.uchile.cl> wrote:
Here is the screenshot, it is a visualization from the data captured from a laser scan sensor from a robot. The visualization shows an object with the red line and a grid to understand quickly the position of the object within the range of the sensor (This case, the object is approximately in the center between 2 to 4 meters from the robot) . The visualization is dynamic, ie: the red line is automatically updated overtime ;)
On Fri, May 15, 2015 at 12:33 PM Alexandre Bergel < alexandre.bergel@me.com> wrote:
Ok, let us know! And send us screenshots :-)
Alexandre
_,.;:~^~:;._,.;:~^~:;._,.;:~^~:;._,.;:~^~:;._,.;: Alexandre Bergel http://www.bergel.eu ^~:;._,.;:~^~:;._,.;:~^~:;._,.;:~^~:;._,.;:~^~:;.
On May 15, 2015, at 10:56 AM, Miguel Campusano mcampusa@dcc.uchile.cl wrote:
Thanks! Both seem to work fine, I'm going to play a bit before deciding for one :)
On Thu, May 14, 2015 at 5:44 PM Peter Uhnák i.uhnak@gmail.com wrote:
You can also use bezier lines or SVG
| v e1 e2 l s p1 p2 path svg|
v := RTView new.

path := 'M -150 150 Q -75 150 -75 75 Q -75 0 0 0'.
svg := RTSVGPath new borderColor: Color red; path: path; element.
v add: svg.

^ v
Peter
On Thu, May 14, 2015 at 10:36 PM, milton mamani akevalion@gmail.com wrote:
> Try with RTArc: > > view := RTView new. > shape := RTArc new > innerRadius: [ :i | i *15]; > externalRadius: [ :i | (i * 15) + 4]; > alphaAngle: 45; > betaAngle: 135; > color: Color black. > view addAll: (shape elementsOn: (1 to: 11) ). > > view > > Cheers, > Milton > > 2015-05-14 16:26 GMT-04:00 Miguel Campusano mcampusa@dcc.uchile.cl > : > >> Hi all, >> I want to draw curved lines in Roassal but I can't find how to. >> The image below is an example of what I am trying to do. >> >> http://www.aboutbookbinding.com/images/Lines-made-with-Gouges.jpg >> >> Bests, >> Miguel >> >> _______________________________________________ >> Moose-dev mailing list >> Moose-dev@iam.unibe.ch >> https://www.iam.unibe.ch/mailman/listinfo/moose-dev >> >> > > _______________________________________________ > Moose-dev mailing list > Moose-dev@iam.unibe.ch > https://www.iam.unibe.ch/mailman/listinfo/moose-dev > > _______________________________________________ Moose-dev mailing list Moose-dev@iam.unibe.ch https://www.iam.unibe.ch/mailman/listinfo/moose-dev
Moose-dev mailing list Moose-dev@iam.unibe.ch https://www.iam.unibe.ch/mailman/listinfo/moose-dev
Moose-dev mailing list Moose-dev@iam.unibe.ch https://www.iam.unibe.ch/mailman/listinfo/moose-dev
Moose-dev mailing list Moose-dev@iam.unibe.ch https://www.iam.unibe.ch/mailman/listinfo/moose-dev
-- www.tudorgirba.com
"Every thing has its own flow" _______________________________________________ Moose-dev mailing list Moose-dev@iam.unibe.ch https://www.iam.unibe.ch/mailman/listinfo/moose-dev
Moose-dev mailing list Moose-dev@iam.unibe.ch https://www.iam.unibe.ch/mailman/listinfo/moose-dev
Thanks Milton! I was on this issue, but you were faster than me :-)
Good job! Alexandre

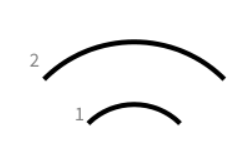
Looks somewhat odd, still, when you change the angles:
view := RTView new. shape := RTArc new innerRadius: [ :i | i *50]; externalRadius: [ :i | (i * 50) + 4]; alphaAngle: 315; betaAngle: 45; color: Color black. elems := shape elementsOn: (1 to: 2). view addAll: elems.
label := RTLabelled new text: #yourself. label left. elems @ label.
view
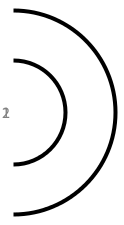
[image: Inline image 1] If you use the angles 270 and 90 (in that order), you get: [image: Inline image 2]
-cbc
On Wed, May 20, 2015 at 1:26 PM, Alexandre Bergel alexandre.bergel@me.com wrote:
Thanks Milton! I was on this issue, but you were faster than me :-)
Good job! Alexandre -- _,.;:~^~:;._,.;:~^~:;._,.;:~^~:;._,.;:~^~:;._,.;: Alexandre Bergel http://www.bergel.eu ^~:;._,.;:~^~:;._,.;:~^~:;._,.;:~^~:;._,.;:~^~:;.
On May 20, 2015, at 3:18 PM, milton mamani akevalion@gmail.com wrote:
Hi
There was a problem in #encompassingRectangle in TRArcShape, try again with the last version of Roassal
<image.png>
Cheers, Milton
2015-05-20 13:51 GMT-04:00 Miguel Campusano mcampusa@dcc.uchile.cl:
Following this, I tried to add labels to the arcs but It is not working as I expected. My code:
view := RTView new. shape := RTArc new innerRadius: [ :i | i *50]; externalRadius: [ :i | (i * 50) + 4]; alphaAngle: 45; betaAngle: 135; color: Color black. elems := shape elementsOn: (1 to: 2). view addAll: elems.
label := RTLabelled new text: #yourself. label left. elems @ label.
view
and the results is the attached image.<labels.png>
I want the labels to be at the left of the arc line. Maybe I'm doing something wrong? any ideas?
Bests, Miguel
On Mon, May 18, 2015 at 5:02 PM Miguel Campusano mcampusa@dcc.uchile.cl wrote:
I want to add labels first, after that I'm going to publish a video. :)
On Mon, May 18, 2015 at 4:52 PM Tudor Girba tudor@tudorgirba.com wrote:
Nice :)
Could you send a video? :)
Doru
On Mon, May 18, 2015 at 8:56 PM, Miguel Campusano < mcampusa@dcc.uchile.cl> wrote:
Here is the screenshot, it is a visualization from the data captured from a laser scan sensor from a robot. The visualization shows an object with the red line and a grid to understand quickly the position of the object within the range of the sensor (This case, the object is approximately in the center between 2 to 4 meters from the robot) . The visualization is dynamic, ie: the red line is automatically updated overtime ;) <laserscan.png>
On Fri, May 15, 2015 at 12:33 PM Alexandre Bergel < alexandre.bergel@me.com> wrote:
Ok, let us know! And send us screenshots :-)
Alexandre
_,.;:~^~:;._,.;:~^~:;._,.;:~^~:;._,.;:~^~:;._,.;: Alexandre Bergel http://www.bergel.eu ^~:;._,.;:~^~:;._,.;:~^~:;._,.;:~^~:;._,.;:~^~:;.
On May 15, 2015, at 10:56 AM, Miguel Campusano < mcampusa@dcc.uchile.cl> wrote:
Thanks! Both seem to work fine, I'm going to play a bit before deciding for one :)
On Thu, May 14, 2015 at 5:44 PM Peter Uhnák i.uhnak@gmail.com wrote:
> You can also use bezier lines or SVG > > ~~~~~~~~~~~~~~~~~~~~~~~~~~~~~~~~~~~~ > | v e1 e2 l s p1 p2 path svg| > v := RTView new. > > path := 'M -150 150 Q -75 150 -75 75 Q -75 0 0 0'. > svg := RTSVGPath new borderColor: Color red; path: path; element. > v add: svg. > > ^ v > ~~~~~~~~~~~~~~~~~~~~~~~~~~~~~~~~~~~~ > > Peter > > On Thu, May 14, 2015 at 10:36 PM, milton mamani <akevalion@gmail.com > > wrote: > >> Try with RTArc: >> >> view := RTView new. >> shape := RTArc new >> innerRadius: [ :i | i *15]; >> externalRadius: [ :i | (i * 15) + 4]; >> alphaAngle: 45; >> betaAngle: 135; >> color: Color black. >> view addAll: (shape elementsOn: (1 to: 11) ). >> >> view >> >> Cheers, >> Milton >> >> 2015-05-14 16:26 GMT-04:00 Miguel Campusano <mcampusa@dcc.uchile.cl >> >: >> >>> Hi all, >>> I want to draw curved lines in Roassal but I can't find how to. >>> The image below is an example of what I am trying to do. >>> >>> http://www.aboutbookbinding.com/images/Lines-made-with-Gouges.jpg >>> >>> Bests, >>> Miguel >>> >>> _______________________________________________ >>> Moose-dev mailing list >>> Moose-dev@iam.unibe.ch >>> https://www.iam.unibe.ch/mailman/listinfo/moose-dev >>> >>> >> >> _______________________________________________ >> Moose-dev mailing list >> Moose-dev@iam.unibe.ch >> https://www.iam.unibe.ch/mailman/listinfo/moose-dev >> >> > _______________________________________________ > Moose-dev mailing list > Moose-dev@iam.unibe.ch > https://www.iam.unibe.ch/mailman/listinfo/moose-dev > _______________________________________________ Moose-dev mailing list Moose-dev@iam.unibe.ch https://www.iam.unibe.ch/mailman/listinfo/moose-dev
Moose-dev mailing list Moose-dev@iam.unibe.ch https://www.iam.unibe.ch/mailman/listinfo/moose-dev
Moose-dev mailing list Moose-dev@iam.unibe.ch https://www.iam.unibe.ch/mailman/listinfo/moose-dev
-- www.tudorgirba.com
"Every thing has its own flow" _______________________________________________ Moose-dev mailing list Moose-dev@iam.unibe.ch https://www.iam.unibe.ch/mailman/listinfo/moose-dev
Moose-dev mailing list Moose-dev@iam.unibe.ch https://www.iam.unibe.ch/mailman/listinfo/moose-dev
Moose-dev mailing list Moose-dev@iam.unibe.ch https://www.iam.unibe.ch/mailman/listinfo/moose-dev
Moose-dev mailing list Moose-dev@iam.unibe.ch https://www.iam.unibe.ch/mailman/listinfo/moose-dev
The label is put on the left of the encompassing rectangle of the arc. It is not always what one wants to achieve, as you demonstrated on your example.
Alexandre
The behavior is still odd. If I change the previous code to 10 visualize ten arcs:
view := RTView new. shape := RTArc new innerRadius: [ :i | i *50]; externalRadius: [ :i | (i * 50) + 4];
alphaAngle: 45;
betaAngle: 135;
color: Color black.
elems := shape elementsOn: (1 to: 10). view addAll: elems.
label := RTLabelled new text: #yourself. label left. elems @ label.
view
The result is this:
I think this happens because it is trying to put the label at the left-center of the arc (encompassing rectangle?). There is a way to put it at the left bottom?
On Wed, May 20, 2015 at 5:37 PM Alexandre Bergel alexandre.bergel@me.com wrote:
The label is put on the left of the encompassing rectangle of the arc. It is not always what one wants to achieve, as you demonstrated on your example.
Alexandre
_,.;:~^~:;._,.;:~^~:;._,.;:~^~:;._,.;:~^~:;._,.;: Alexandre Bergel http://www.bergel.eu ^~:;._,.;:~^~:;._,.;:~^~:;._,.;:~^~:;._,.;:~^~:;.
On May 20, 2015, at 4:22 PM, Chris Cunningham cunningham.cb@gmail.com wrote:
Looks somewhat odd, still, when you change the angles:
view := RTView new. shape := RTArc new innerRadius: [ :i | i *50]; externalRadius: [ :i | (i * 50) + 4]; alphaAngle: 315; betaAngle: 45; color: Color black. elems := shape elementsOn: (1 to: 2). view addAll: elems.
label := RTLabelled new text: #yourself. label left. elems @ label.
view
<image.png>
If you use the angles 270 and 90 (in that order), you get:
<image.png>
-cbc
On Wed, May 20, 2015 at 1:26 PM, Alexandre Bergel <alexandre.bergel@me.com
wrote:
Thanks Milton! I was on this issue, but you were faster than me :-)
Good job! Alexandre -- _,.;:~^~:;._,.;:~^~:;._,.;:~^~:;._,.;:~^~:;._,.;: Alexandre Bergel http://www.bergel.eu ^~:;._,.;:~^~:;._,.;:~^~:;._,.;:~^~:;._,.;:~^~:;.
On May 20, 2015, at 3:18 PM, milton mamani akevalion@gmail.com wrote:
Hi
There was a problem in #encompassingRectangle in TRArcShape, try again with the last version of Roassal
<image.png>
Cheers, Milton
2015-05-20 13:51 GMT-04:00 Miguel Campusano mcampusa@dcc.uchile.cl:
Following this, I tried to add labels to the arcs but It is not working as I expected. My code:
view := RTView new. shape := RTArc new innerRadius: [ :i | i *50]; externalRadius: [ :i | (i * 50) + 4]; alphaAngle: 45; betaAngle: 135; color: Color black. elems := shape elementsOn: (1 to: 2). view addAll: elems.
label := RTLabelled new text: #yourself. label left. elems @ label.
view
and the results is the attached image.<labels.png>
I want the labels to be at the left of the arc line. Maybe I'm doing something wrong? any ideas?
Bests, Miguel
On Mon, May 18, 2015 at 5:02 PM Miguel Campusano mcampusa@dcc.uchile.cl wrote:
I want to add labels first, after that I'm going to publish a video. :)
On Mon, May 18, 2015 at 4:52 PM Tudor Girba tudor@tudorgirba.com wrote:
Nice :)
Could you send a video? :)
Doru
On Mon, May 18, 2015 at 8:56 PM, Miguel Campusano < mcampusa@dcc.uchile.cl> wrote:
Here is the screenshot, it is a visualization from the data captured from a laser scan sensor from a robot. The visualization shows an object with the red line and a grid to understand quickly the position of the object within the range of the sensor (This case, the object is approximately in the center between 2 to 4 meters from the robot) . The visualization is dynamic, ie: the red line is automatically updated overtime ;) <laserscan.png>
On Fri, May 15, 2015 at 12:33 PM Alexandre Bergel < alexandre.bergel@me.com> wrote:
> Ok, let us know! And send us screenshots :-) > > Alexandre > -- > _,.;:~^~:;._,.;:~^~:;._,.;:~^~:;._,.;:~^~:;._,.;: > Alexandre Bergel http://www.bergel.eu > ^~:;._,.;:~^~:;._,.;:~^~:;._,.;:~^~:;._,.;:~^~:;. > > > > On May 15, 2015, at 10:56 AM, Miguel Campusano < > mcampusa@dcc.uchile.cl> wrote: > > Thanks! > Both seem to work fine, I'm going to play a bit before deciding for > one :) > > On Thu, May 14, 2015 at 5:44 PM Peter Uhnák i.uhnak@gmail.com > wrote: > >> You can also use bezier lines or SVG >> >> ~~~~~~~~~~~~~~~~~~~~~~~~~~~~~~~~~~~~ >> | v e1 e2 l s p1 p2 path svg| >> v := RTView new. >> >> path := 'M -150 150 Q -75 150 -75 75 Q -75 0 0 0'. >> svg := RTSVGPath new borderColor: Color red; path: path; element. >> v add: svg. >> >> ^ v >> ~~~~~~~~~~~~~~~~~~~~~~~~~~~~~~~~~~~~ >> >> Peter >> >> On Thu, May 14, 2015 at 10:36 PM, milton mamani < >> akevalion@gmail.com> wrote: >> >>> Try with RTArc: >>> >>> view := RTView new. >>> shape := RTArc new >>> innerRadius: [ :i | i *15]; >>> externalRadius: [ :i | (i * 15) + 4]; >>> alphaAngle: 45; >>> betaAngle: 135; >>> color: Color black. >>> view addAll: (shape elementsOn: (1 to: 11) ). >>> >>> view >>> >>> Cheers, >>> Milton >>> >>> 2015-05-14 16:26 GMT-04:00 Miguel Campusano < >>> mcampusa@dcc.uchile.cl>: >>> >>>> Hi all, >>>> I want to draw curved lines in Roassal but I can't find how to. >>>> The image below is an example of what I am trying to do. >>>> >>>> http://www.aboutbookbinding.com/images/Lines-made-with-Gouges.jpg >>>> >>>> Bests, >>>> Miguel >>>> >>>> _______________________________________________ >>>> Moose-dev mailing list >>>> Moose-dev@iam.unibe.ch >>>> https://www.iam.unibe.ch/mailman/listinfo/moose-dev >>>> >>>> >>> >>> _______________________________________________ >>> Moose-dev mailing list >>> Moose-dev@iam.unibe.ch >>> https://www.iam.unibe.ch/mailman/listinfo/moose-dev >>> >>> >> _______________________________________________ >> Moose-dev mailing list >> Moose-dev@iam.unibe.ch >> https://www.iam.unibe.ch/mailman/listinfo/moose-dev >> > _______________________________________________ > Moose-dev mailing list > Moose-dev@iam.unibe.ch > https://www.iam.unibe.ch/mailman/listinfo/moose-dev > > > _______________________________________________ > Moose-dev mailing list > Moose-dev@iam.unibe.ch > https://www.iam.unibe.ch/mailman/listinfo/moose-dev >
Moose-dev mailing list Moose-dev@iam.unibe.ch https://www.iam.unibe.ch/mailman/listinfo/moose-dev
-- www.tudorgirba.com
"Every thing has its own flow" _______________________________________________ Moose-dev mailing list Moose-dev@iam.unibe.ch https://www.iam.unibe.ch/mailman/listinfo/moose-dev
Moose-dev mailing list Moose-dev@iam.unibe.ch https://www.iam.unibe.ch/mailman/listinfo/moose-dev
Moose-dev mailing list Moose-dev@iam.unibe.ch https://www.iam.unibe.ch/mailman/listinfo/moose-dev
Moose-dev mailing list Moose-dev@iam.unibe.ch https://www.iam.unibe.ch/mailman/listinfo/moose-dev
Moose-dev mailing list Moose-dev@iam.unibe.ch https://www.iam.unibe.ch/mailman/listinfo/moose-dev
Moose-dev mailing list Moose-dev@iam.unibe.ch https://www.iam.unibe.ch/mailman/listinfo/moose-dev
Maybe a way to tag where you want the label? Bottom left, center right, etc?
On Wed, May 20, 2015 at 1:51 PM, Miguel Campusano mcampusa@dcc.uchile.cl wrote:
The behavior is still odd. If I change the previous code to 10 visualize ten arcs:
view := RTView new. shape := RTArc new innerRadius: [ :i | i *50]; externalRadius: [ :i | (i * 50) + 4];
alphaAngle: 45;
betaAngle: 135;
color: Color black.
elems := shape elementsOn: (1 to: 10). view addAll: elems.
label := RTLabelled new text: #yourself. label left. elems @ label.
view
The result is this:
I think this happens because it is trying to put the label at the left-center of the arc (encompassing rectangle?). There is a way to put it at the left bottom?
On Wed, May 20, 2015 at 5:37 PM Alexandre Bergel alexandre.bergel@me.com wrote:
The label is put on the left of the encompassing rectangle of the arc. It is not always what one wants to achieve, as you demonstrated on your example.
Alexandre
_,.;:~^~:;._,.;:~^~:;._,.;:~^~:;._,.;:~^~:;._,.;: Alexandre Bergel http://www.bergel.eu ^~:;._,.;:~^~:;._,.;:~^~:;._,.;:~^~:;._,.;:~^~:;.
On May 20, 2015, at 4:22 PM, Chris Cunningham cunningham.cb@gmail.com wrote:
Looks somewhat odd, still, when you change the angles:
view := RTView new. shape := RTArc new innerRadius: [ :i | i *50]; externalRadius: [ :i | (i * 50) + 4]; alphaAngle: 315; betaAngle: 45; color: Color black. elems := shape elementsOn: (1 to: 2). view addAll: elems.
label := RTLabelled new text: #yourself. label left. elems @ label.
view
<image.png>
If you use the angles 270 and 90 (in that order), you get:
<image.png>
-cbc
On Wed, May 20, 2015 at 1:26 PM, Alexandre Bergel < alexandre.bergel@me.com> wrote:
Thanks Milton! I was on this issue, but you were faster than me :-)
Good job! Alexandre -- _,.;:~^~:;._,.;:~^~:;._,.;:~^~:;._,.;:~^~:;._,.;: Alexandre Bergel http://www.bergel.eu ^~:;._,.;:~^~:;._,.;:~^~:;._,.;:~^~:;._,.;:~^~:;.
On May 20, 2015, at 3:18 PM, milton mamani akevalion@gmail.com wrote:
Hi
There was a problem in #encompassingRectangle in TRArcShape, try again with the last version of Roassal
<image.png>
Cheers, Milton
2015-05-20 13:51 GMT-04:00 Miguel Campusano mcampusa@dcc.uchile.cl:
Following this, I tried to add labels to the arcs but It is not working as I expected. My code:
view := RTView new. shape := RTArc new innerRadius: [ :i | i *50]; externalRadius: [ :i | (i * 50) + 4]; alphaAngle: 45; betaAngle: 135; color: Color black. elems := shape elementsOn: (1 to: 2). view addAll: elems.
label := RTLabelled new text: #yourself. label left. elems @ label.
view
and the results is the attached image.<labels.png>
I want the labels to be at the left of the arc line. Maybe I'm doing something wrong? any ideas?
Bests, Miguel
On Mon, May 18, 2015 at 5:02 PM Miguel Campusano < mcampusa@dcc.uchile.cl> wrote:
I want to add labels first, after that I'm going to publish a video. :)
On Mon, May 18, 2015 at 4:52 PM Tudor Girba tudor@tudorgirba.com wrote:
Nice :)
Could you send a video? :)
Doru
On Mon, May 18, 2015 at 8:56 PM, Miguel Campusano < mcampusa@dcc.uchile.cl> wrote:
> Here is the screenshot, it is a visualization from the data captured > from a laser scan sensor from a robot. > The visualization shows an object with the red line and a grid to > understand quickly the position of the object within the range of the > sensor (This case, the object is approximately in the center between 2 to 4 > meters from the robot) . The visualization is dynamic, ie: the red line is > automatically updated overtime ;) > <laserscan.png> > > > On Fri, May 15, 2015 at 12:33 PM Alexandre Bergel < > alexandre.bergel@me.com> wrote: > >> Ok, let us know! And send us screenshots :-) >> >> Alexandre >> -- >> _,.;:~^~:;._,.;:~^~:;._,.;:~^~:;._,.;:~^~:;._,.;: >> Alexandre Bergel http://www.bergel.eu >> ^~:;._,.;:~^~:;._,.;:~^~:;._,.;:~^~:;._,.;:~^~:;. >> >> >> >> On May 15, 2015, at 10:56 AM, Miguel Campusano < >> mcampusa@dcc.uchile.cl> wrote: >> >> Thanks! >> Both seem to work fine, I'm going to play a bit before deciding for >> one :) >> >> On Thu, May 14, 2015 at 5:44 PM Peter Uhnák i.uhnak@gmail.com >> wrote: >> >>> You can also use bezier lines or SVG >>> >>> ~~~~~~~~~~~~~~~~~~~~~~~~~~~~~~~~~~~~ >>> | v e1 e2 l s p1 p2 path svg| >>> v := RTView new. >>> >>> path := 'M -150 150 Q -75 150 -75 75 Q -75 0 0 0'. >>> svg := RTSVGPath new borderColor: Color red; path: path; element. >>> v add: svg. >>> >>> ^ v >>> ~~~~~~~~~~~~~~~~~~~~~~~~~~~~~~~~~~~~ >>> >>> Peter >>> >>> On Thu, May 14, 2015 at 10:36 PM, milton mamani < >>> akevalion@gmail.com> wrote: >>> >>>> Try with RTArc: >>>> >>>> view := RTView new. >>>> shape := RTArc new >>>> innerRadius: [ :i | i *15]; >>>> externalRadius: [ :i | (i * 15) + 4]; >>>> alphaAngle: 45; >>>> betaAngle: 135; >>>> color: Color black. >>>> view addAll: (shape elementsOn: (1 to: 11) ). >>>> >>>> view >>>> >>>> Cheers, >>>> Milton >>>> >>>> 2015-05-14 16:26 GMT-04:00 Miguel Campusano < >>>> mcampusa@dcc.uchile.cl>: >>>> >>>>> Hi all, >>>>> I want to draw curved lines in Roassal but I can't find how to. >>>>> The image below is an example of what I am trying to do. >>>>> >>>>> http://www.aboutbookbinding.com/images/Lines-made-with-Gouges.jpg >>>>> >>>>> Bests, >>>>> Miguel >>>>> >>>>> _______________________________________________ >>>>> Moose-dev mailing list >>>>> Moose-dev@iam.unibe.ch >>>>> https://www.iam.unibe.ch/mailman/listinfo/moose-dev >>>>> >>>>> >>>> >>>> _______________________________________________ >>>> Moose-dev mailing list >>>> Moose-dev@iam.unibe.ch >>>> https://www.iam.unibe.ch/mailman/listinfo/moose-dev >>>> >>>> >>> _______________________________________________ >>> Moose-dev mailing list >>> Moose-dev@iam.unibe.ch >>> https://www.iam.unibe.ch/mailman/listinfo/moose-dev >>> >> _______________________________________________ >> Moose-dev mailing list >> Moose-dev@iam.unibe.ch >> https://www.iam.unibe.ch/mailman/listinfo/moose-dev >> >> >> _______________________________________________ >> Moose-dev mailing list >> Moose-dev@iam.unibe.ch >> https://www.iam.unibe.ch/mailman/listinfo/moose-dev >> > > _______________________________________________ > Moose-dev mailing list > Moose-dev@iam.unibe.ch > https://www.iam.unibe.ch/mailman/listinfo/moose-dev > >
-- www.tudorgirba.com
"Every thing has its own flow" _______________________________________________ Moose-dev mailing list Moose-dev@iam.unibe.ch https://www.iam.unibe.ch/mailman/listinfo/moose-dev
Moose-dev mailing list Moose-dev@iam.unibe.ch https://www.iam.unibe.ch/mailman/listinfo/moose-dev
Moose-dev mailing list Moose-dev@iam.unibe.ch https://www.iam.unibe.ch/mailman/listinfo/moose-dev
Moose-dev mailing list Moose-dev@iam.unibe.ch https://www.iam.unibe.ch/mailman/listinfo/moose-dev
Moose-dev mailing list Moose-dev@iam.unibe.ch https://www.iam.unibe.ch/mailman/listinfo/moose-dev
Moose-dev mailing list Moose-dev@iam.unibe.ch https://www.iam.unibe.ch/mailman/listinfo/moose-dev
Moose-dev mailing list Moose-dev@iam.unibe.ch https://www.iam.unibe.ch/mailman/listinfo/moose-dev
Hi Miguel,
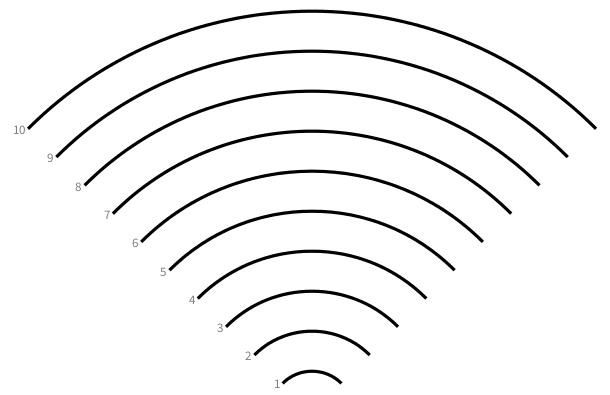
you can now place the label on the bottom left of an element.
view := RTView new. view @ RTDraggableView.
shape := RTArc new innerRadius: [ :i | i *50]; externalRadius: [ :i | (i * 50) + 4];
alphaAngle: 45; betaAngle: 135; color: Color black. elems := shape elementsOn: (1 to: 10). view addAll: elems. elems @ RTHighlightable.
label := RTLabelled new text: #yourself. label bottomLeft. elems @ label.
view
On May 20, 2015, at 5:51 PM, Miguel Campusano mcampusa@dcc.uchile.cl wrote:
The behavior is still odd. If I change the previous code to 10 visualize ten arcs:
view := RTView new. shape := RTArc new innerRadius: [ :i | i *50]; externalRadius: [ :i | (i * 50) + 4];
alphaAngle: 45; betaAngle: 135; color: Color black.elems := shape elementsOn: (1 to: 10). view addAll: elems.
label := RTLabelled new text: #yourself. label left. elems @ label.
view
The result is this:<labels2.png>
I think this happens because it is trying to put the label at the left-center of the arc (encompassing rectangle?). There is a way to put it at the left bottom?
On Wed, May 20, 2015 at 5:37 PM Alexandre Bergel alexandre.bergel@me.com wrote: The label is put on the left of the encompassing rectangle of the arc. It is not always what one wants to achieve, as you demonstrated on your example.
Alexandre
_,.;:~^~:;._,.;:~^~:;._,.;:~^~:;._,.;:~^~:;._,.;: Alexandre Bergel http://www.bergel.eu ^~:;._,.;:~^~:;._,.;:~^~:;._,.;:~^~:;._,.;:~^~:;.
On May 20, 2015, at 4:22 PM, Chris Cunningham cunningham.cb@gmail.com wrote:
Looks somewhat odd, still, when you change the angles:
view := RTView new. shape := RTArc new innerRadius: [ :i | i *50]; externalRadius: [ :i | (i * 50) + 4]; alphaAngle: 315; betaAngle: 45; color: Color black. elems := shape elementsOn: (1 to: 2). view addAll: elems.
label := RTLabelled new text: #yourself. label left. elems @ label.
view
<image.png> If you use the angles 270 and 90 (in that order), you get: <image.png>
-cbc
On Wed, May 20, 2015 at 1:26 PM, Alexandre Bergel alexandre.bergel@me.com wrote: Thanks Milton! I was on this issue, but you were faster than me :-)
Good job! Alexandre -- _,.;:~^~:;._,.;:~^~:;._,.;:~^~:;._,.;:~^~:;._,.;: Alexandre Bergel http://www.bergel.eu ^~:;._,.;:~^~:;._,.;:~^~:;._,.;:~^~:;._,.;:~^~:;.
On May 20, 2015, at 3:18 PM, milton mamani akevalion@gmail.com wrote:
Hi
There was a problem in #encompassingRectangle in TRArcShape, try again with the last version of Roassal
<image.png>
Cheers, Milton
2015-05-20 13:51 GMT-04:00 Miguel Campusano mcampusa@dcc.uchile.cl: Following this, I tried to add labels to the arcs but It is not working as I expected. My code:
view := RTView new. shape := RTArc new innerRadius: [ :i | i *50]; externalRadius: [ :i | (i * 50) + 4]; alphaAngle: 45; betaAngle: 135; color: Color black. elems := shape elementsOn: (1 to: 2). view addAll: elems.
label := RTLabelled new text: #yourself. label left. elems @ label.
view
and the results is the attached image.<labels.png>
I want the labels to be at the left of the arc line. Maybe I'm doing something wrong? any ideas?
Bests, Miguel
On Mon, May 18, 2015 at 5:02 PM Miguel Campusano mcampusa@dcc.uchile.cl wrote: I want to add labels first, after that I'm going to publish a video. :)
On Mon, May 18, 2015 at 4:52 PM Tudor Girba tudor@tudorgirba.com wrote: Nice :)
Could you send a video? :)
Doru
On Mon, May 18, 2015 at 8:56 PM, Miguel Campusano mcampusa@dcc.uchile.cl wrote: Here is the screenshot, it is a visualization from the data captured from a laser scan sensor from a robot. The visualization shows an object with the red line and a grid to understand quickly the position of the object within the range of the sensor (This case, the object is approximately in the center between 2 to 4 meters from the robot) . The visualization is dynamic, ie: the red line is automatically updated overtime ;) <laserscan.png>
On Fri, May 15, 2015 at 12:33 PM Alexandre Bergel alexandre.bergel@me.com wrote: Ok, let us know! And send us screenshots :-)
Alexandre
_,.;:~^~:;._,.;:~^~:;._,.;:~^~:;._,.;:~^~:;._,.;: Alexandre Bergel http://www.bergel.eu ^~:;._,.;:~^~:;._,.;:~^~:;._,.;:~^~:;._,.;:~^~:;.
On May 15, 2015, at 10:56 AM, Miguel Campusano mcampusa@dcc.uchile.cl wrote:
Thanks! Both seem to work fine, I'm going to play a bit before deciding for one :)
On Thu, May 14, 2015 at 5:44 PM Peter Uhnák i.uhnak@gmail.com wrote: You can also use bezier lines or SVG
| v e1 e2 l s p1 p2 path svg|
v := RTView new.

path := 'M -150 150 Q -75 150 -75 75 Q -75 0 0 0'.
svg := RTSVGPath new borderColor: Color red; path: path; element.
v add: svg.

^ v
Peter
On Thu, May 14, 2015 at 10:36 PM, milton mamani akevalion@gmail.com wrote: Try with RTArc:
view := RTView new. shape := RTArc new innerRadius: [ :i | i *15]; externalRadius: [ :i | (i * 15) + 4]; alphaAngle: 45; betaAngle: 135; color: Color black. view addAll: (shape elementsOn: (1 to: 11) ).
view
Cheers, Milton
2015-05-14 16:26 GMT-04:00 Miguel Campusano mcampusa@dcc.uchile.cl: Hi all, I want to draw curved lines in Roassal but I can't find how to. The image below is an example of what I am trying to do.
http://www.aboutbookbinding.com/images/Lines-made-with-Gouges.jpg
Bests, Miguel
Moose-dev mailing list Moose-dev@iam.unibe.ch https://www.iam.unibe.ch/mailman/listinfo/moose-dev
Moose-dev mailing list Moose-dev@iam.unibe.ch https://www.iam.unibe.ch/mailman/listinfo/moose-dev
Moose-dev mailing list Moose-dev@iam.unibe.ch https://www.iam.unibe.ch/mailman/listinfo/moose-dev _______________________________________________ Moose-dev mailing list Moose-dev@iam.unibe.ch https://www.iam.unibe.ch/mailman/listinfo/moose-dev
Moose-dev mailing list Moose-dev@iam.unibe.ch https://www.iam.unibe.ch/mailman/listinfo/moose-dev
Moose-dev mailing list Moose-dev@iam.unibe.ch https://www.iam.unibe.ch/mailman/listinfo/moose-dev
-- www.tudorgirba.com
"Every thing has its own flow" _______________________________________________ Moose-dev mailing list Moose-dev@iam.unibe.ch https://www.iam.unibe.ch/mailman/listinfo/moose-dev
Moose-dev mailing list Moose-dev@iam.unibe.ch https://www.iam.unibe.ch/mailman/listinfo/moose-dev
Moose-dev mailing list Moose-dev@iam.unibe.ch https://www.iam.unibe.ch/mailman/listinfo/moose-dev
Moose-dev mailing list Moose-dev@iam.unibe.ch https://www.iam.unibe.ch/mailman/listinfo/moose-dev
Moose-dev mailing list Moose-dev@iam.unibe.ch https://www.iam.unibe.ch/mailman/listinfo/moose-dev
Moose-dev mailing list Moose-dev@iam.unibe.ch https://www.iam.unibe.ch/mailman/listinfo/moose-dev _______________________________________________ Moose-dev mailing list Moose-dev@iam.unibe.ch https://www.iam.unibe.ch/mailman/listinfo/moose-dev
Thanks Alex, I made a short video with the visualization :)
https://dl.dropboxusercontent.com/u/12478485/laserscan.ogv
On Thu, May 21, 2015 at 9:43 AM Alexandre Bergel alexandre.bergel@me.com wrote:
Hi Miguel,
you can now place the label on the bottom left of an element.
view := RTView new. view @ RTDraggableView.
shape := RTArc new innerRadius: [ :i | i *50]; externalRadius: [ :i | (i * 50) + 4];
alphaAngle: 45;
betaAngle: 135;
color: Color black.
elems := shape elementsOn: (1 to: 10). view addAll: elems. elems @ RTHighlightable.
label := RTLabelled new text: #yourself. label bottomLeft. elems @ label.
view
On May 20, 2015, at 5:51 PM, Miguel Campusano mcampusa@dcc.uchile.cl wrote:
The behavior is still odd. If I change the previous code to 10 visualize ten arcs:
view := RTView new. shape := RTArc new innerRadius: [ :i | i *50]; externalRadius: [ :i | (i * 50) + 4];
alphaAngle: 45;
betaAngle: 135;
color: Color black.
elems := shape elementsOn: (1 to: 10). view addAll: elems.
label := RTLabelled new text: #yourself. label left. elems @ label.
view
The result is this:<labels2.png>
I think this happens because it is trying to put the label at the left-center of the arc (encompassing rectangle?). There is a way to put it at the left bottom?
On Wed, May 20, 2015 at 5:37 PM Alexandre Bergel alexandre.bergel@me.com wrote: The label is put on the left of the encompassing rectangle of the arc. It is not always what one wants to achieve, as you demonstrated on your example.
Alexandre
_,.;:~^~:;._,.;:~^~:;._,.;:~^~:;._,.;:~^~:;._,.;: Alexandre Bergel http://www.bergel.eu ^~:;._,.;:~^~:;._,.;:~^~:;._,.;:~^~:;._,.;:~^~:;.
On May 20, 2015, at 4:22 PM, Chris Cunningham cunningham.cb@gmail.com wrote:
Looks somewhat odd, still, when you change the angles:
view := RTView new. shape := RTArc new innerRadius: [ :i | i *50]; externalRadius: [ :i | (i * 50) + 4]; alphaAngle: 315; betaAngle: 45; color: Color black. elems := shape elementsOn: (1 to: 2). view addAll: elems.
label := RTLabelled new text: #yourself. label left. elems @ label.
view
<image.png>
If you use the angles 270 and 90 (in that order), you get:
<image.png>
-cbc
On Wed, May 20, 2015 at 1:26 PM, Alexandre Bergel <alexandre.bergel@me.com
wrote:
Thanks Milton! I was on this issue, but you were faster than me :-)
Good job! Alexandre -- _,.;:~^~:;._,.;:~^~:;._,.;:~^~:;._,.;:~^~:;._,.;: Alexandre Bergel http://www.bergel.eu ^~:;._,.;:~^~:;._,.;:~^~:;._,.;:~^~:;._,.;:~^~:;.
On May 20, 2015, at 3:18 PM, milton mamani akevalion@gmail.com wrote:
Hi
There was a problem in #encompassingRectangle in TRArcShape, try again with the last version of Roassal
<image.png>
Cheers, Milton
2015-05-20 13:51 GMT-04:00 Miguel Campusano mcampusa@dcc.uchile.cl: Following this, I tried to add labels to the arcs but It is not working as I expected. My code:
view := RTView new. shape := RTArc new innerRadius: [ :i | i *50]; externalRadius: [ :i | (i * 50) + 4]; alphaAngle: 45; betaAngle: 135; color: Color black. elems := shape elementsOn: (1 to: 2). view addAll: elems.
label := RTLabelled new text: #yourself. label left. elems @ label.
view
and the results is the attached image.<labels.png>
I want the labels to be at the left of the arc line. Maybe I'm doing something wrong? any ideas?
Bests, Miguel
On Mon, May 18, 2015 at 5:02 PM Miguel Campusano mcampusa@dcc.uchile.cl wrote: I want to add labels first, after that I'm going to publish a video. :)
On Mon, May 18, 2015 at 4:52 PM Tudor Girba tudor@tudorgirba.com wrote: Nice :)
Could you send a video? :)
Doru
On Mon, May 18, 2015 at 8:56 PM, Miguel Campusano <mcampusa@dcc.uchile.cl
wrote:
Here is the screenshot, it is a visualization from the data captured from a laser scan sensor from a robot. The visualization shows an object with the red line and a grid to understand quickly the position of the object within the range of the sensor (This case, the object is approximately in the center between 2 to 4 meters from the robot) . The visualization is dynamic, ie: the red line is automatically updated overtime ;) <laserscan.png>
On Fri, May 15, 2015 at 12:33 PM Alexandre Bergel alexandre.bergel@me.com wrote: Ok, let us know! And send us screenshots :-)
Alexandre
_,.;:~^~:;._,.;:~^~:;._,.;:~^~:;._,.;:~^~:;._,.;: Alexandre Bergel http://www.bergel.eu ^~:;._,.;:~^~:;._,.;:~^~:;._,.;:~^~:;._,.;:~^~:;.
On May 15, 2015, at 10:56 AM, Miguel Campusano mcampusa@dcc.uchile.cl wrote:
Thanks! Both seem to work fine, I'm going to play a bit before deciding for one :)
On Thu, May 14, 2015 at 5:44 PM Peter Uhnák i.uhnak@gmail.com wrote: You can also use bezier lines or SVG
| v e1 e2 l s p1 p2 path svg|
v := RTView new.

path := 'M -150 150 Q -75 150 -75 75 Q -75 0 0 0'.
svg := RTSVGPath new borderColor: Color red; path: path; element.
v add: svg.

^ v
Peter
On Thu, May 14, 2015 at 10:36 PM, milton mamani <akevalion@gmail.com
wrote:
Try with RTArc:
view := RTView new. shape := RTArc new innerRadius: [ :i | i *15]; externalRadius: [ :i | (i * 15) + 4]; alphaAngle: 45; betaAngle: 135; color: Color black. view addAll: (shape elementsOn: (1 to: 11) ).
view
Cheers, Milton
2015-05-14 16:26 GMT-04:00 Miguel Campusano mcampusa@dcc.uchile.cl: Hi all, I want to draw curved lines in Roassal but I can't find how to. The image below is an example of what I am trying to do.
http://www.aboutbookbinding.com/images/Lines-made-with-Gouges.jpg
Bests, Miguel
Moose-dev mailing list Moose-dev@iam.unibe.ch https://www.iam.unibe.ch/mailman/listinfo/moose-dev
Moose-dev mailing list Moose-dev@iam.unibe.ch https://www.iam.unibe.ch/mailman/listinfo/moose-dev
Moose-dev mailing list Moose-dev@iam.unibe.ch https://www.iam.unibe.ch/mailman/listinfo/moose-dev _______________________________________________ Moose-dev mailing list Moose-dev@iam.unibe.ch https://www.iam.unibe.ch/mailman/listinfo/moose-dev
Moose-dev mailing list Moose-dev@iam.unibe.ch https://www.iam.unibe.ch/mailman/listinfo/moose-dev
Moose-dev mailing list Moose-dev@iam.unibe.ch https://www.iam.unibe.ch/mailman/listinfo/moose-dev
-- www.tudorgirba.com
"Every thing has its own flow" _______________________________________________ Moose-dev mailing list Moose-dev@iam.unibe.ch https://www.iam.unibe.ch/mailman/listinfo/moose-dev
Moose-dev mailing list Moose-dev@iam.unibe.ch https://www.iam.unibe.ch/mailman/listinfo/moose-dev
Moose-dev mailing list Moose-dev@iam.unibe.ch https://www.iam.unibe.ch/mailman/listinfo/moose-dev
Moose-dev mailing list Moose-dev@iam.unibe.ch https://www.iam.unibe.ch/mailman/listinfo/moose-dev
Moose-dev mailing list Moose-dev@iam.unibe.ch https://www.iam.unibe.ch/mailman/listinfo/moose-dev
Moose-dev mailing list Moose-dev@iam.unibe.ch https://www.iam.unibe.ch/mailman/listinfo/moose-dev _______________________________________________ Moose-dev mailing list Moose-dev@iam.unibe.ch https://www.iam.unibe.ch/mailman/listinfo/moose-dev
-- _,.;:~^~:;._,.;:~^~:;._,.;:~^~:;._,.;:~^~:;._,.;: Alexandre Bergel http://www.bergel.eu ^~:;._,.;:~^~:;._,.;:~^~:;._,.;:~^~:;._,.;:~^~:;.
Moose-dev mailing list Moose-dev@iam.unibe.ch https://www.iam.unibe.ch/mailman/listinfo/moose-dev
Wow! And it seems to be relatively fast. Well done!
Alexandre
On May 22, 2015, at 10:24 PM, Miguel Campusano mcampusa@dcc.uchile.cl wrote:
Thanks Alex, I made a short video with the visualization :)
https://dl.dropboxusercontent.com/u/12478485/laserscan.ogv
On Thu, May 21, 2015 at 9:43 AM Alexandre Bergel alexandre.bergel@me.com wrote: Hi Miguel,
you can now place the label on the bottom left of an element.
<Screen Shot 2015-05-21 at 10.42.50 AM.png> view := RTView new. view @ RTDraggableView.
shape := RTArc new innerRadius: [ :i | i *50]; externalRadius: [ :i | (i * 50) + 4];
alphaAngle: 45;
betaAngle: 135;
color: Color black.
elems := shape elementsOn: (1 to: 10). view addAll: elems. elems @ RTHighlightable.
label := RTLabelled new text: #yourself. label bottomLeft. elems @ label.
view
On May 20, 2015, at 5:51 PM, Miguel Campusano mcampusa@dcc.uchile.cl wrote:
The behavior is still odd. If I change the previous code to 10 visualize ten arcs:
view := RTView new. shape := RTArc new innerRadius: [ :i | i *50]; externalRadius: [ :i | (i * 50) + 4];
alphaAngle: 45;
betaAngle: 135;
color: Color black.
elems := shape elementsOn: (1 to: 10). view addAll: elems.
label := RTLabelled new text: #yourself. label left. elems @ label.
view
The result is this:<labels2.png>
I think this happens because it is trying to put the label at the left-center of the arc (encompassing rectangle?). There is a way to put it at the left bottom?
On Wed, May 20, 2015 at 5:37 PM Alexandre Bergel alexandre.bergel@me.com wrote: The label is put on the left of the encompassing rectangle of the arc. It is not always what one wants to achieve, as you demonstrated on your example.
Alexandre
_,.;:~^~:;._,.;:~^~:;._,.;:~^~:;._,.;:~^~:;._,.;: Alexandre Bergel http://www.bergel.eu ^~:;._,.;:~^~:;._,.;:~^~:;._,.;:~^~:;._,.;:~^~:;.
On May 20, 2015, at 4:22 PM, Chris Cunningham cunningham.cb@gmail.com wrote:
Looks somewhat odd, still, when you change the angles:
view := RTView new. shape := RTArc new innerRadius: [ :i | i *50]; externalRadius: [ :i | (i * 50) + 4]; alphaAngle: 315; betaAngle: 45; color: Color black. elems := shape elementsOn: (1 to: 2). view addAll: elems.
label := RTLabelled new text: #yourself. label left. elems @ label.
view
<image.png> If you use the angles 270 and 90 (in that order), you get: <image.png>
-cbc
On Wed, May 20, 2015 at 1:26 PM, Alexandre Bergel alexandre.bergel@me.com wrote: Thanks Milton! I was on this issue, but you were faster than me :-)
Good job! Alexandre -- _,.;:~^~:;._,.;:~^~:;._,.;:~^~:;._,.;:~^~:;._,.;: Alexandre Bergel http://www.bergel.eu ^~:;._,.;:~^~:;._,.;:~^~:;._,.;:~^~:;._,.;:~^~:;.
On May 20, 2015, at 3:18 PM, milton mamani akevalion@gmail.com wrote:
Hi
There was a problem in #encompassingRectangle in TRArcShape, try again with the last version of Roassal
<image.png>
Cheers, Milton
2015-05-20 13:51 GMT-04:00 Miguel Campusano mcampusa@dcc.uchile.cl: Following this, I tried to add labels to the arcs but It is not working as I expected. My code:
view := RTView new. shape := RTArc new innerRadius: [ :i | i *50]; externalRadius: [ :i | (i * 50) + 4]; alphaAngle: 45; betaAngle: 135; color: Color black. elems := shape elementsOn: (1 to: 2). view addAll: elems.
label := RTLabelled new text: #yourself. label left. elems @ label.
view
and the results is the attached image.<labels.png>
I want the labels to be at the left of the arc line. Maybe I'm doing something wrong? any ideas?
Bests, Miguel
On Mon, May 18, 2015 at 5:02 PM Miguel Campusano mcampusa@dcc.uchile.cl wrote: I want to add labels first, after that I'm going to publish a video. :)
On Mon, May 18, 2015 at 4:52 PM Tudor Girba tudor@tudorgirba.com wrote: Nice :)
Could you send a video? :)
Doru
On Mon, May 18, 2015 at 8:56 PM, Miguel Campusano mcampusa@dcc.uchile.cl wrote: Here is the screenshot, it is a visualization from the data captured from a laser scan sensor from a robot. The visualization shows an object with the red line and a grid to understand quickly the position of the object within the range of the sensor (This case, the object is approximately in the center between 2 to 4 meters from the robot) . The visualization is dynamic, ie: the red line is automatically updated overtime ;) <laserscan.png>
On Fri, May 15, 2015 at 12:33 PM Alexandre Bergel alexandre.bergel@me.com wrote: Ok, let us know! And send us screenshots :-)
Alexandre
_,.;:~^~:;._,.;:~^~:;._,.;:~^~:;._,.;:~^~:;._,.;: Alexandre Bergel http://www.bergel.eu ^~:;._,.;:~^~:;._,.;:~^~:;._,.;:~^~:;._,.;:~^~:;.
On May 15, 2015, at 10:56 AM, Miguel Campusano mcampusa@dcc.uchile.cl wrote:
Thanks! Both seem to work fine, I'm going to play a bit before deciding for one :)
On Thu, May 14, 2015 at 5:44 PM Peter Uhnák i.uhnak@gmail.com wrote: You can also use bezier lines or SVG
| v e1 e2 l s p1 p2 path svg|
v := RTView new.

path := 'M -150 150 Q -75 150 -75 75 Q -75 0 0 0'.
svg := RTSVGPath new borderColor: Color red; path: path; element.
v add: svg.

^ v
Peter
On Thu, May 14, 2015 at 10:36 PM, milton mamani akevalion@gmail.com wrote: Try with RTArc:
view := RTView new. shape := RTArc new innerRadius: [ :i | i *15]; externalRadius: [ :i | (i * 15) + 4]; alphaAngle: 45; betaAngle: 135; color: Color black. view addAll: (shape elementsOn: (1 to: 11) ).
view
Cheers, Milton
2015-05-14 16:26 GMT-04:00 Miguel Campusano mcampusa@dcc.uchile.cl: Hi all, I want to draw curved lines in Roassal but I can't find how to. The image below is an example of what I am trying to do.
http://www.aboutbookbinding.com/images/Lines-made-with-Gouges.jpg
Bests, Miguel
Moose-dev mailing list Moose-dev@iam.unibe.ch https://www.iam.unibe.ch/mailman/listinfo/moose-dev
Moose-dev mailing list Moose-dev@iam.unibe.ch https://www.iam.unibe.ch/mailman/listinfo/moose-dev
Moose-dev mailing list Moose-dev@iam.unibe.ch https://www.iam.unibe.ch/mailman/listinfo/moose-dev _______________________________________________ Moose-dev mailing list Moose-dev@iam.unibe.ch https://www.iam.unibe.ch/mailman/listinfo/moose-dev
Moose-dev mailing list Moose-dev@iam.unibe.ch https://www.iam.unibe.ch/mailman/listinfo/moose-dev
Moose-dev mailing list Moose-dev@iam.unibe.ch https://www.iam.unibe.ch/mailman/listinfo/moose-dev
-- www.tudorgirba.com
"Every thing has its own flow" _______________________________________________ Moose-dev mailing list Moose-dev@iam.unibe.ch https://www.iam.unibe.ch/mailman/listinfo/moose-dev
Moose-dev mailing list Moose-dev@iam.unibe.ch https://www.iam.unibe.ch/mailman/listinfo/moose-dev
Moose-dev mailing list Moose-dev@iam.unibe.ch https://www.iam.unibe.ch/mailman/listinfo/moose-dev
Moose-dev mailing list Moose-dev@iam.unibe.ch https://www.iam.unibe.ch/mailman/listinfo/moose-dev
Moose-dev mailing list Moose-dev@iam.unibe.ch https://www.iam.unibe.ch/mailman/listinfo/moose-dev
Moose-dev mailing list Moose-dev@iam.unibe.ch https://www.iam.unibe.ch/mailman/listinfo/moose-dev _______________________________________________ Moose-dev mailing list Moose-dev@iam.unibe.ch https://www.iam.unibe.ch/mailman/listinfo/moose-dev
-- _,.;:~^~:;._,.;:~^~:;._,.;:~^~:;._,.;:~^~:;._,.;: Alexandre Bergel http://www.bergel.eu ^~:;._,.;:~^~:;._,.;:~^~:;._,.;:~^~:;._,.;:~^~:;.
Moose-dev mailing list Moose-dev@iam.unibe.ch https://www.iam.unibe.ch/mailman/listinfo/moose-dev <Screen Shot 2015-05-21 at 10.42.50 AM.png>_______________________________________________ Moose-dev mailing list Moose-dev@iam.unibe.ch https://www.iam.unibe.ch/mailman/listinfo/moose-dev
Wow, indeed. This is impressive.
Keep it up.
Cheers, Doru
On Sun, May 24, 2015 at 11:45 AM, Alexandre Bergel alexandre.bergel@me.com wrote:
Wow! And it seems to be relatively fast. Well done!
Alexandre
On May 22, 2015, at 10:24 PM, Miguel Campusano mcampusa@dcc.uchile.cl
wrote:
Thanks Alex, I made a short video with the visualization :)
https://dl.dropboxusercontent.com/u/12478485/laserscan.ogv
On Thu, May 21, 2015 at 9:43 AM Alexandre Bergel <
alexandre.bergel@me.com> wrote:
Hi Miguel,
you can now place the label on the bottom left of an element.
<Screen Shot 2015-05-21 at 10.42.50 AM.png> view := RTView new. view @ RTDraggableView.
shape := RTArc new innerRadius: [ :i | i *50]; externalRadius: [ :i | (i * 50) + 4];
alphaAngle: 45;
betaAngle: 135;
color: Color black.
elems := shape elementsOn: (1 to: 10). view addAll: elems. elems @ RTHighlightable.
label := RTLabelled new text: #yourself. label bottomLeft. elems @ label.
view
On May 20, 2015, at 5:51 PM, Miguel Campusano mcampusa@dcc.uchile.cl
wrote:
The behavior is still odd. If I change the previous code to 10
visualize ten arcs:
view := RTView new. shape := RTArc new innerRadius: [ :i | i *50]; externalRadius: [ :i | (i * 50) + 4];
alphaAngle: 45;
betaAngle: 135;
color: Color black.
elems := shape elementsOn: (1 to: 10). view addAll: elems.
label := RTLabelled new text: #yourself. label left. elems @ label.
view
The result is this:<labels2.png>
I think this happens because it is trying to put the label at the
left-center of the arc (encompassing rectangle?). There is a way to put it at the left bottom?
On Wed, May 20, 2015 at 5:37 PM Alexandre Bergel <
alexandre.bergel@me.com> wrote:
The label is put on the left of the encompassing rectangle of the arc. It is not always what one wants to achieve, as you demonstrated on your
example.
Alexandre
_,.;:~^~:;._,.;:~^~:;._,.;:~^~:;._,.;:~^~:;._,.;: Alexandre Bergel http://www.bergel.eu ^~:;._,.;:~^~:;._,.;:~^~:;._,.;:~^~:;._,.;:~^~:;.
On May 20, 2015, at 4:22 PM, Chris Cunningham cunningham.cb@gmail.com
wrote:
Looks somewhat odd, still, when you change the angles:
view := RTView new. shape := RTArc new innerRadius: [ :i | i *50]; externalRadius: [ :i | (i * 50) + 4]; alphaAngle: 315; betaAngle: 45; color: Color black. elems := shape elementsOn: (1 to: 2). view addAll: elems.
label := RTLabelled new text: #yourself. label left. elems @ label.
view
<image.png> If you use the angles 270 and 90 (in that order), you get: <image.png>
-cbc
On Wed, May 20, 2015 at 1:26 PM, Alexandre Bergel <
alexandre.bergel@me.com> wrote:
Thanks Milton! I was on this issue, but you were faster than me :-)
Good job! Alexandre -- _,.;:~^~:;._,.;:~^~:;._,.;:~^~:;._,.;:~^~:;._,.;: Alexandre Bergel http://www.bergel.eu ^~:;._,.;:~^~:;._,.;:~^~:;._,.;:~^~:;._,.;:~^~:;.
On May 20, 2015, at 3:18 PM, milton mamani akevalion@gmail.com
wrote:
Hi
There was a problem in #encompassingRectangle in TRArcShape, try
again with the last version of Roassal
<image.png>
Cheers, Milton
2015-05-20 13:51 GMT-04:00 Miguel Campusano mcampusa@dcc.uchile.cl: Following this, I tried to add labels to the arcs but It is not
working as I expected. My code:
view := RTView new. shape := RTArc new innerRadius: [ :i | i *50]; externalRadius: [ :i | (i * 50) + 4]; alphaAngle: 45; betaAngle: 135; color: Color black. elems := shape elementsOn: (1 to: 2). view addAll: elems.
label := RTLabelled new text: #yourself. label left. elems @ label.
view
and the results is the attached image.<labels.png>
I want the labels to be at the left of the arc line. Maybe I'm doing
something wrong? any ideas?
Bests, Miguel
On Mon, May 18, 2015 at 5:02 PM Miguel Campusano <
mcampusa@dcc.uchile.cl> wrote:
I want to add labels first, after that I'm going to publish a video.
:)
On Mon, May 18, 2015 at 4:52 PM Tudor Girba tudor@tudorgirba.com
wrote:
Nice :)
Could you send a video? :)
Doru
On Mon, May 18, 2015 at 8:56 PM, Miguel Campusano <
mcampusa@dcc.uchile.cl> wrote:
Here is the screenshot, it is a visualization from the data captured
from a laser scan sensor from a robot.
The visualization shows an object with the red line and a grid to
understand quickly the position of the object within the range of the sensor (This case, the object is approximately in the center between 2 to 4 meters from the robot) . The visualization is dynamic, ie: the red line is automatically updated overtime ;)
<laserscan.png>
On Fri, May 15, 2015 at 12:33 PM Alexandre Bergel <
alexandre.bergel@me.com> wrote:
Ok, let us know! And send us screenshots :-)
Alexandre
_,.;:~^~:;._,.;:~^~:;._,.;:~^~:;._,.;:~^~:;._,.;: Alexandre Bergel http://www.bergel.eu ^~:;._,.;:~^~:;._,.;:~^~:;._,.;:~^~:;._,.;:~^~:;.
On May 15, 2015, at 10:56 AM, Miguel Campusano <
mcampusa@dcc.uchile.cl> wrote:
Thanks! Both seem to work fine, I'm going to play a bit before deciding for
one :)
On Thu, May 14, 2015 at 5:44 PM Peter Uhnák i.uhnak@gmail.com
wrote:
You can also use bezier lines or SVG
| v e1 e2 l s p1 p2 path svg|
v := RTView new.

path := 'M -150 150 Q -75 150 -75 75 Q -75 0 0 0'.
svg := RTSVGPath new borderColor: Color red; path: path; element.
v add: svg.

^ v
Peter
On Thu, May 14, 2015 at 10:36 PM, milton mamani akevalion@gmail.com
wrote:
Try with RTArc:
view := RTView new. shape := RTArc new innerRadius: [ :i | i *15]; externalRadius: [ :i | (i * 15) + 4]; alphaAngle: 45; betaAngle: 135; color: Color black. view addAll: (shape elementsOn: (1 to: 11) ).
view
Cheers, Milton
2015-05-14 16:26 GMT-04:00 Miguel Campusano <mcampusa@dcc.uchile.cl
:
Hi all, I want to draw curved lines in Roassal but I can't find how to. The image below is an example of what I am trying to do.
http://www.aboutbookbinding.com/images/Lines-made-with-Gouges.jpg
Bests, Miguel
Moose-dev mailing list Moose-dev@iam.unibe.ch https://www.iam.unibe.ch/mailman/listinfo/moose-dev
Moose-dev mailing list Moose-dev@iam.unibe.ch https://www.iam.unibe.ch/mailman/listinfo/moose-dev
Moose-dev mailing list Moose-dev@iam.unibe.ch https://www.iam.unibe.ch/mailman/listinfo/moose-dev _______________________________________________ Moose-dev mailing list Moose-dev@iam.unibe.ch https://www.iam.unibe.ch/mailman/listinfo/moose-dev
Moose-dev mailing list Moose-dev@iam.unibe.ch https://www.iam.unibe.ch/mailman/listinfo/moose-dev
Moose-dev mailing list Moose-dev@iam.unibe.ch https://www.iam.unibe.ch/mailman/listinfo/moose-dev
-- www.tudorgirba.com
"Every thing has its own flow" _______________________________________________ Moose-dev mailing list Moose-dev@iam.unibe.ch https://www.iam.unibe.ch/mailman/listinfo/moose-dev
Moose-dev mailing list Moose-dev@iam.unibe.ch https://www.iam.unibe.ch/mailman/listinfo/moose-dev
Moose-dev mailing list Moose-dev@iam.unibe.ch https://www.iam.unibe.ch/mailman/listinfo/moose-dev
Moose-dev mailing list Moose-dev@iam.unibe.ch https://www.iam.unibe.ch/mailman/listinfo/moose-dev
Moose-dev mailing list Moose-dev@iam.unibe.ch https://www.iam.unibe.ch/mailman/listinfo/moose-dev
Moose-dev mailing list Moose-dev@iam.unibe.ch https://www.iam.unibe.ch/mailman/listinfo/moose-dev _______________________________________________ Moose-dev mailing list Moose-dev@iam.unibe.ch https://www.iam.unibe.ch/mailman/listinfo/moose-dev
-- _,.;:~^~:;._,.;:~^~:;._,.;:~^~:;._,.;:~^~:;._,.;: Alexandre Bergel http://www.bergel.eu ^~:;._,.;:~^~:;._,.;:~^~:;._,.;:~^~:;._,.;:~^~:;.
Moose-dev mailing list Moose-dev@iam.unibe.ch https://www.iam.unibe.ch/mailman/listinfo/moose-dev <Screen Shot 2015-05-21 at 10.42.50
AM.png>_______________________________________________
Moose-dev mailing list Moose-dev@iam.unibe.ch https://www.iam.unibe.ch/mailman/listinfo/moose-dev
-- _,.;:~^~:;._,.;:~^~:;._,.;:~^~:;._,.;:~^~:;._,.;: Alexandre Bergel http://www.bergel.eu ^~:;._,.;:~^~:;._,.;:~^~:;._,.;:~^~:;._,.;:~^~:;.
Moose-dev mailing list Moose-dev@iam.unibe.ch https://www.iam.unibe.ch/mailman/listinfo/moose-dev

Yes, it looks very cool :-) I can’t wait to see it in action on more complex scenarios :-P
On May 24, 2015, at 08:53, Tudor Girba tudor@tudorgirba.com wrote:
Wow, indeed. This is impressive.
Keep it up.
Cheers, Doru
On Sun, May 24, 2015 at 11:45 AM, Alexandre Bergel <alexandre.bergel@me.com mailto:alexandre.bergel@me.com> wrote: Wow! And it seems to be relatively fast. Well done!
Alexandre
On May 22, 2015, at 10:24 PM, Miguel Campusano <mcampusa@dcc.uchile.cl mailto:mcampusa@dcc.uchile.cl> wrote:
Thanks Alex, I made a short video with the visualization :)
https://dl.dropboxusercontent.com/u/12478485/laserscan.ogv https://dl.dropboxusercontent.com/u/12478485/laserscan.ogv
---> Save our in-boxes! http://emailcharter.org <---
Johan Fabry - http://pleiad.cl/~jfabry PLEIAD lab - Computer Science Department (DCC) - University of Chile

Yes very nice viz but why not reusing existing ros viz like rviz http://wiki.ros.org/rviz ?
On Sun, May 24, 2015 at 3:31 PM, Johan Fabry jfabry@dcc.uchile.cl wrote:
Yes, it looks very cool :-) I can’t wait to see it in action on more complex scenarios :-P
On May 24, 2015, at 08:53, Tudor Girba tudor@tudorgirba.com wrote:
Wow, indeed. This is impressive.
Keep it up.
Cheers, Doru
On Sun, May 24, 2015 at 11:45 AM, Alexandre Bergel alexandre.bergel@me.com wrote:
Wow! And it seems to be relatively fast. Well done!
Alexandre
On May 22, 2015, at 10:24 PM, Miguel Campusano mcampusa@dcc.uchile.cl wrote:
Thanks Alex, I made a short video with the visualization :)
---> Save our in-boxes! http://emailcharter.org <---
Johan Fabry - http://pleiad.cl/~jfabry PLEIAD lab - Computer Science Department (DCC) - University of Chile
Moose-dev mailing list Moose-dev@iam.unibe.ch https://www.iam.unibe.ch/mailman/listinfo/moose-dev
Rviz is a good visualization, but it focuses on a representing the data in a 3d environment. Rviz, in my experience, represents the interactions of the robot (with its sensors) in the environment, you can draw maps and do a lot of things. However, rviz does not provide access to the data itself. Long history short, while I can see there is an object with the laser scan at a certain distance, I can not see the actual distance of the object. Sometimes we want more info about the data to see what values are best suited to use in our programs.
btw, thanks eveyrone for your support on this :)
On Sun, May 24, 2015 at 10:45 AM Serge Stinckwich < serge.stinckwich@gmail.com> wrote:
Yes very nice viz but why not reusing existing ros viz like rviz http://wiki.ros.org/rviz ?
On Sun, May 24, 2015 at 3:31 PM, Johan Fabry jfabry@dcc.uchile.cl wrote:
Yes, it looks very cool :-) I can’t wait to see it in action on more
complex
scenarios :-P
On May 24, 2015, at 08:53, Tudor Girba tudor@tudorgirba.com wrote:
Wow, indeed. This is impressive.
Keep it up.
Cheers, Doru
On Sun, May 24, 2015 at 11:45 AM, Alexandre Bergel <
alexandre.bergel@me.com>
wrote:
Wow! And it seems to be relatively fast. Well done!
Alexandre
On May 22, 2015, at 10:24 PM, Miguel Campusano <
mcampusa@dcc.uchile.cl>
wrote:
Thanks Alex, I made a short video with the visualization :)
---> Save our in-boxes! http://emailcharter.org <---
Johan Fabry - http://pleiad.cl/~jfabry PLEIAD lab - Computer Science Department (DCC) - University of Chile
Moose-dev mailing list Moose-dev@iam.unibe.ch https://www.iam.unibe.ch/mailman/listinfo/moose-dev
-- Serge Stinckwich UCBN & UMI UMMISCO 209 (IRD/UPMC) Every DSL ends up being Smalltalk http://www.doesnotunderstand.org/
Moose-dev mailing list Moose-dev@iam.unibe.ch https://www.iam.unibe.ch/mailman/listinfo/moose-dev
On Mon, May 25, 2015 at 4:48 PM, Miguel Campusano mcampusa@dcc.uchile.cl wrote:
Rviz is a good visualization, but it focuses on a representing the data in a 3d environment. Rviz, in my experience, represents the interactions of the robot (with its sensors) in the environment, you can draw maps and do a lot of things.
rviz is not only for 3D but also for 2D viz. Look at this video for example: http://wiki.ros.org/navigation/Tutorials/Using%20rviz%20with%20the%20Navigat...
However, rviz does not provide access to the data itself. Long history short, while I can see there is an object with the laser scan at a certain distance, I can not see the actual distance of the object. Sometimes we want more info about the data to see what values are best suited to use in our programs.
Yes, you are right rviz does not provide access to the data and is quite difficult to customize to specific needs. You have to write plugins in order to add more visualisations.
Having a robotic data viz engine that could be extended with ROASSAL scripting could be nice. This is what you are trying to do ?
On Tue, May 26, 2015 at 6:35 AM Serge Stinckwich serge.stinckwich@gmail.com wrote:
On Mon, May 25, 2015 at 4:48 PM, Miguel Campusano mcampusa@dcc.uchile.cl wrote:
Rviz is a good visualization, but it focuses on a representing the data
in a
3d environment. Rviz, in my experience, represents the interactions of
the
robot (with its sensors) in the environment, you can draw maps and do a
lot
of things.
rviz is not only for 3D but also for 2D viz. Look at this video for example:
http://wiki.ros.org/navigation/Tutorials/Using%20rviz%20with%20the%20Navigat...
Right, I have seen that a long time ago but I forgot it :( . But still it holds the idea that rviz focuses on representing the data in the environment (drawing the map for example) rather than the data itself (in a point of time, what was the distance between the robot and the nearest wall)
However, rviz does not provide access to the data itself. Long history short, while I can see there is an object with the laser scan at a
certain
distance, I can not see the actual distance of the object. Sometimes we
want
more info about the data to see what values are best suited to use in our programs.
Yes, you are right rviz does not provide access to the data and is quite difficult to customize to specific needs. You have to write plugins in order to add more visualisations.
Yes, you can represent the data in the visualization, but still with rviz I can't see how you can have direct access to the data from the visualization. At least, I can't see how you can do something like we did we the laser scan in rviz -showing information about the area of detection and other things we have in mind ;)-
Having a robotic data viz engine that could be extended with ROASSAL
scripting could be nice. This is what you are trying to do ?
Our main focus is, for every different sensor, understand the data separately and use that data in algorithms and programs in a live programming context. For example, for us, having the distance of an object with the laser scan has a great value because we can determine the best suited distance to take different actions. After the actions are implemented, you can see with the visualization if the actions are being done at the right moment. But I can not denied that having a robotic data viz engine extensible with roassal scripting would be cool.
Nice to see Pharo is more and more used in robotics context. I was doing something similar with Player/Stage before ROS: https://www.youtube.com/watch?v=6hhKzEf_jcw
On Sun, May 24, 2015 at 11:45 AM, Alexandre Bergel alexandre.bergel@me.com wrote:
Wow! And it seems to be relatively fast. Well done!
Alexandre
On May 22, 2015, at 10:24 PM, Miguel Campusano mcampusa@dcc.uchile.cl wrote:
Thanks Alex, I made a short video with the visualization :)
https://dl.dropboxusercontent.com/u/12478485/laserscan.ogv
On Thu, May 21, 2015 at 9:43 AM Alexandre Bergel alexandre.bergel@me.com wrote: Hi Miguel,
you can now place the label on the bottom left of an element.
<Screen Shot 2015-05-21 at 10.42.50 AM.png> view := RTView new. view @ RTDraggableView.
shape := RTArc new innerRadius: [ :i | i *50]; externalRadius: [ :i | (i * 50) + 4];
alphaAngle: 45;
betaAngle: 135;
color: Color black.
elems := shape elementsOn: (1 to: 10). view addAll: elems. elems @ RTHighlightable.
label := RTLabelled new text: #yourself. label bottomLeft. elems @ label.
view
On May 20, 2015, at 5:51 PM, Miguel Campusano mcampusa@dcc.uchile.cl wrote:
The behavior is still odd. If I change the previous code to 10 visualize ten arcs:
view := RTView new. shape := RTArc new innerRadius: [ :i | i *50]; externalRadius: [ :i | (i * 50) + 4];
alphaAngle: 45;
betaAngle: 135;
color: Color black.
elems := shape elementsOn: (1 to: 10). view addAll: elems.
label := RTLabelled new text: #yourself. label left. elems @ label.
view
The result is this:<labels2.png>
I think this happens because it is trying to put the label at the left-center of the arc (encompassing rectangle?). There is a way to put it at the left bottom?
On Wed, May 20, 2015 at 5:37 PM Alexandre Bergel alexandre.bergel@me.com wrote: The label is put on the left of the encompassing rectangle of the arc. It is not always what one wants to achieve, as you demonstrated on your example.
Alexandre
_,.;:~^~:;._,.;:~^~:;._,.;:~^~:;._,.;:~^~:;._,.;: Alexandre Bergel http://www.bergel.eu ^~:;._,.;:~^~:;._,.;:~^~:;._,.;:~^~:;._,.;:~^~:;.
On May 20, 2015, at 4:22 PM, Chris Cunningham cunningham.cb@gmail.com wrote:
Looks somewhat odd, still, when you change the angles:
view := RTView new. shape := RTArc new innerRadius: [ :i | i *50]; externalRadius: [ :i | (i * 50) + 4]; alphaAngle: 315; betaAngle: 45; color: Color black. elems := shape elementsOn: (1 to: 2). view addAll: elems.
label := RTLabelled new text: #yourself. label left. elems @ label.
view
<image.png> If you use the angles 270 and 90 (in that order), you get: <image.png>
-cbc
On Wed, May 20, 2015 at 1:26 PM, Alexandre Bergel alexandre.bergel@me.com wrote: Thanks Milton! I was on this issue, but you were faster than me :-)
Good job! Alexandre -- _,.;:~^~:;._,.;:~^~:;._,.;:~^~:;._,.;:~^~:;._,.;: Alexandre Bergel http://www.bergel.eu ^~:;._,.;:~^~:;._,.;:~^~:;._,.;:~^~:;._,.;:~^~:;.
On May 20, 2015, at 3:18 PM, milton mamani akevalion@gmail.com wrote:
Hi
There was a problem in #encompassingRectangle in TRArcShape, try again with the last version of Roassal
<image.png>
Cheers, Milton
2015-05-20 13:51 GMT-04:00 Miguel Campusano mcampusa@dcc.uchile.cl: Following this, I tried to add labels to the arcs but It is not working as I expected. My code:
view := RTView new. shape := RTArc new innerRadius: [ :i | i *50]; externalRadius: [ :i | (i * 50) + 4]; alphaAngle: 45; betaAngle: 135; color: Color black. elems := shape elementsOn: (1 to: 2). view addAll: elems.
label := RTLabelled new text: #yourself. label left. elems @ label.
view
and the results is the attached image.<labels.png>
I want the labels to be at the left of the arc line. Maybe I'm doing something wrong? any ideas?
Bests, Miguel
On Mon, May 18, 2015 at 5:02 PM Miguel Campusano mcampusa@dcc.uchile.cl wrote: I want to add labels first, after that I'm going to publish a video. :)
On Mon, May 18, 2015 at 4:52 PM Tudor Girba tudor@tudorgirba.com wrote: Nice :)
Could you send a video? :)
Doru
On Mon, May 18, 2015 at 8:56 PM, Miguel Campusano mcampusa@dcc.uchile.cl wrote: Here is the screenshot, it is a visualization from the data captured from a laser scan sensor from a robot. The visualization shows an object with the red line and a grid to understand quickly the position of the object within the range of the sensor (This case, the object is approximately in the center between 2 to 4 meters from the robot) . The visualization is dynamic, ie: the red line is automatically updated overtime ;) <laserscan.png>
On Fri, May 15, 2015 at 12:33 PM Alexandre Bergel alexandre.bergel@me.com wrote: Ok, let us know! And send us screenshots :-)
Alexandre
_,.;:~^~:;._,.;:~^~:;._,.;:~^~:;._,.;:~^~:;._,.;: Alexandre Bergel http://www.bergel.eu ^~:;._,.;:~^~:;._,.;:~^~:;._,.;:~^~:;._,.;:~^~:;.
On May 15, 2015, at 10:56 AM, Miguel Campusano mcampusa@dcc.uchile.cl wrote:
Thanks! Both seem to work fine, I'm going to play a bit before deciding for one :)
On Thu, May 14, 2015 at 5:44 PM Peter Uhnák i.uhnak@gmail.com wrote: You can also use bezier lines or SVG
| v e1 e2 l s p1 p2 path svg|
v := RTView new.

path := 'M -150 150 Q -75 150 -75 75 Q -75 0 0 0'.
svg := RTSVGPath new borderColor: Color red; path: path; element.
v add: svg.

^ v
Peter
On Thu, May 14, 2015 at 10:36 PM, milton mamani akevalion@gmail.com wrote: Try with RTArc:
view := RTView new. shape := RTArc new innerRadius: [ :i | i *15]; externalRadius: [ :i | (i * 15) + 4]; alphaAngle: 45; betaAngle: 135; color: Color black. view addAll: (shape elementsOn: (1 to: 11) ).
view
Cheers, Milton
2015-05-14 16:26 GMT-04:00 Miguel Campusano mcampusa@dcc.uchile.cl: Hi all, I want to draw curved lines in Roassal but I can't find how to. The image below is an example of what I am trying to do.
http://www.aboutbookbinding.com/images/Lines-made-with-Gouges.jpg
Bests, Miguel
Moose-dev mailing list Moose-dev@iam.unibe.ch https://www.iam.unibe.ch/mailman/listinfo/moose-dev
Moose-dev mailing list Moose-dev@iam.unibe.ch https://www.iam.unibe.ch/mailman/listinfo/moose-dev
Moose-dev mailing list Moose-dev@iam.unibe.ch https://www.iam.unibe.ch/mailman/listinfo/moose-dev _______________________________________________ Moose-dev mailing list Moose-dev@iam.unibe.ch https://www.iam.unibe.ch/mailman/listinfo/moose-dev
Moose-dev mailing list Moose-dev@iam.unibe.ch https://www.iam.unibe.ch/mailman/listinfo/moose-dev
Moose-dev mailing list Moose-dev@iam.unibe.ch https://www.iam.unibe.ch/mailman/listinfo/moose-dev
-- www.tudorgirba.com
"Every thing has its own flow" _______________________________________________ Moose-dev mailing list Moose-dev@iam.unibe.ch https://www.iam.unibe.ch/mailman/listinfo/moose-dev
Moose-dev mailing list Moose-dev@iam.unibe.ch https://www.iam.unibe.ch/mailman/listinfo/moose-dev
Moose-dev mailing list Moose-dev@iam.unibe.ch https://www.iam.unibe.ch/mailman/listinfo/moose-dev
Moose-dev mailing list Moose-dev@iam.unibe.ch https://www.iam.unibe.ch/mailman/listinfo/moose-dev
Moose-dev mailing list Moose-dev@iam.unibe.ch https://www.iam.unibe.ch/mailman/listinfo/moose-dev
Moose-dev mailing list Moose-dev@iam.unibe.ch https://www.iam.unibe.ch/mailman/listinfo/moose-dev _______________________________________________ Moose-dev mailing list Moose-dev@iam.unibe.ch https://www.iam.unibe.ch/mailman/listinfo/moose-dev
-- _,.;:~^~:;._,.;:~^~:;._,.;:~^~:;._,.;:~^~:;._,.;: Alexandre Bergel http://www.bergel.eu ^~:;._,.;:~^~:;._,.;:~^~:;._,.;:~^~:;._,.;:~^~:;.
Moose-dev mailing list Moose-dev@iam.unibe.ch https://www.iam.unibe.ch/mailman/listinfo/moose-dev <Screen Shot 2015-05-21 at 10.42.50 AM.png>_______________________________________________ Moose-dev mailing list Moose-dev@iam.unibe.ch https://www.iam.unibe.ch/mailman/listinfo/moose-dev
-- _,.;:~^~:;._,.;:~^~:;._,.;:~^~:;._,.;:~^~:;._,.;: Alexandre Bergel http://www.bergel.eu ^~:;._,.;:~^~:;._,.;:~^~:;._,.;:~^~:;._,.;:~^~:;.
Moose-dev mailing list Moose-dev@iam.unibe.ch https://www.iam.unibe.ch/mailman/listinfo/moose-dev
Very nice, and the simulation actually looks cute :-) Did the laser scan there give you various different scan intervals and that’s why you see the different triangles on the simulation?
On May 24, 2015, at 09:25, Serge Stinckwich serge.stinckwich@gmail.com wrote:
Nice to see Pharo is more and more used in robotics context. I was doing something similar with Player/Stage before ROS: https://www.youtube.com/watch?v=6hhKzEf_jcw
---> Save our in-boxes! http://emailcharter.org <---
Johan Fabry - http://pleiad.cl/~jfabry PLEIAD lab - Computer Science Department (DCC) - University of Chile
On Sun, May 24, 2015 at 3:33 PM, Johan Fabry jfabry@dcc.uchile.cl wrote:
Very nice, and the simulation actually looks cute :-) Did the laser scan there give you various different scan intervals and that’s why you see the different triangles on the simulation?
I was using Player/Stage simulation engine: http://playerstage.sourceforge.net/ and connecting to the simulation from Pharo.
The main problem was that the protocol was a little bit cryptic and I have to look at the data exchanged between Player/Stage and other client in order to understand how it works ... really annoying.
The code is always available here: https://github.com/SergeStinckwich/PlayerST
I guess we can do something similar now with MORSE or other ROS simulation engine.
This is not laser scan but sonar scan. Triangles are the way sonar scans are represented by Player Stage.
Cheers,
On May 24, 2015, at 10:40, Serge Stinckwich serge.stinckwich@gmail.com wrote:
The main problem was that the protocol was a little bit cryptic and I have to look at the data exchanged between Player/Stage and other client in order to understand how it works ... really annoying.
Oh, yes that must have been unpleasant :-(
The code is always available here: https://github.com/SergeStinckwich/PlayerST
I guess we can do something similar now with MORSE or other ROS simulation engine.
Yes, we are now doing this with ROS (PhaROS) and Gazebo. I never looked at MORSE actually, do you prefer to use it over Gazebo. Also, are you going to ESUG? We should have a chat...
This is not laser scan but sonar scan. Triangles are the way sonar scans are represented by Player Stage.
Ah OK I misunderstood. It could be interesting to do some visualization of sonar scans as well, maybe we will add it to the TODO list.
---> Save our in-boxes! http://emailcharter.org <---
Johan Fabry - http://pleiad.cl/~jfabry PLEIAD lab - Computer Science Department (DCC) - University of Chile
On Sun, May 24, 2015 at 3:50 PM, Johan Fabry jfabry@dcc.uchile.cl wrote:
On May 24, 2015, at 10:40, Serge Stinckwich serge.stinckwich@gmail.com wrote:
The main problem was that the protocol was a little bit cryptic and I have to look at the data exchanged between Player/Stage and other client in order to understand how it works ... really annoying.
Oh, yes that must have been unpleasant :-(
At that time, there was no ROS ;-)
The code is always available here: https://github.com/SergeStinckwich/PlayerST
I guess we can do something similar now with MORSE or other ROS simulation engine.
Yes, we are now doing this with ROS (PhaROS) and Gazebo. I never looked at MORSE actually, do you prefer to use it over Gazebo.
MORSE is more complex than GAZEBO, because based on Blender. Easier to customize than GAZEBO because written in Python.
Also, are you going to ESUG? We should have a chat...
Yes, I'm currently registering.
This is not laser scan but sonar scan. Triangles are the way sonar scans are represented by Player Stage.
Ah OK I misunderstood. It could be interesting to do some visualization of sonar scans as well, maybe we will add it to the TODO list.
:-)
Excellent!!!!
Alexandre

Le 14/5/15 22:43, Peter Uhnák a écrit :
You can also use bezier lines or SVG
| v e1 e2 l s p1 p2 path svg|
v := RTView new.

path := 'M -150 150 Q -75 150 -75 75 Q -75 0 0 0'.
svg := RTSVGPath new borderColor: Color red; path: path; element.
I do not understand why roassal still has SVG path in its model.
this code should be
| v e1 e2 l s p1 p2 path svg| v := RTView new. path := 'M -150 150 Q -75 150 -75 75 Q -75 0 0 0'. arc := RTSVGPathImporter new path: path. arc borderColor: Color red; path: path.
To me having svg inside the Roassal domain.
Stef
v add: svg.
^ v
Peter

On Thu, May 14, 2015 at 10:36 PM, milton mamani <akevalion@gmail.com
<mailto:akevalion@gmail.com>> wrote:

    Try with RTArc:

    view := RTView new.
    shape := RTArc new
    innerRadius: [ :i | i *15];
    externalRadius: [ :i | (i * 15) + 4];
    alphaAngle: 45;
    betaAngle: 135;
    color: Color black.
    view addAll: (shape elementsOn: (1 to: 11) ).

    view

    Cheers,
    Milton

    2015-05-14 16:26 GMT-04:00 Miguel Campusano
    <mcampusa@dcc.uchile.cl <mailto:mcampusa@dcc.uchile.cl>>:

        Hi all,
        I want to draw curved lines in Roassal but I can't find how to.
        The image below is an example of what I am trying to do.

        http://www.aboutbookbinding.com/images/Lines-made-with-Gouges.jpg

        Bests,
        Miguel

        _______________________________________________
        Moose-dev mailing list
        Moose-dev@iam.unibe.ch <mailto:Moose-dev@iam.unibe.ch>
        https://www.iam.unibe.ch/mailman/listinfo/moose-dev


    _______________________________________________
    Moose-dev mailing list
    Moose-dev@iam.unibe.ch <mailto:Moose-dev@iam.unibe.ch>
    https://www.iam.unibe.ch/mailman/listinfo/moose-dev


_______________________________________________
Moose-dev mailing list
Moose-dev@iam.unibe.ch
https://www.iam.unibe.ch/mailman/listinfo/moose-dev
On Tue, Jun 2, 2015 at 9:58 PM, stepharo stepharo@free.fr wrote:
Le 14/5/15 22:43, Peter Uhnák a écrit :
You can also use bezier lines or SVG
| v e1 e2 l s p1 p2 path svg|
v := RTView new.

path := 'M -150 150 Q -75 150 -75 75 Q -75 0 0 0'.
svg := RTSVGPath new borderColor: Color red; path: path; element.


I do not understand why roassal still has SVG path in its model.

this code should be

| v e1 e2 l s p1 p2 path svg|
v := RTView new.
path := 'M -150 150 Q -75 150 -75 75 Q -75 0 0 0'.
arc := RTSVGPathImporter new path: path.
arc borderColor: Color red; path: path.

To me having svg inside the Roassal domain.
This is not particularly friendly to change; if I want to modify or update it after it has been create it wouldn't be possible. (Not that Roassal is keen to such changes but I can at least force it.)
Also, what is the actual benefit of having an importer?
Peter
-
 Alexandre Bergel
 -
 Chris Cunningham
 -
 Johan Fabry
 -
 Miguel Campusano
 -
 milton mamani
 -
 Peter Uhnák
 -
 Serge Stinckwich
 -
 stepharo
 -
 Tudor Girba