
[NB: forwarded to the moose mailing list as other may be interested in this]
Hi Thomas,
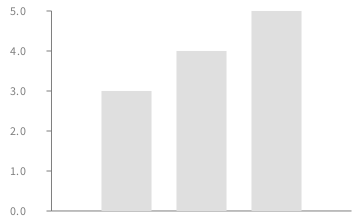
This is a tricky situation, for which I have found a solution. Consider the script -=-=--=-=--=-=--=-=- b := RTGrapher new.
d := RTData new. d points: #(3 4 5). d barShape. b add: d.
b axisX noLabel; noTick. b -=-=--=-=--=-=--=-=-
produces
As always.
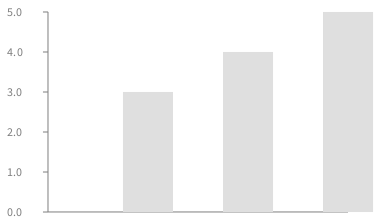
You can now send #noAlignmentOffset to the data to remove the offset. -=-=-=-=-=-= b := RTGrapher new.
d := RTData new. d points: #(3 4 5). d barShape. d noAlignmentOffset. b add: d.
b axisX noLabel; noTick. b -=-=-=-=-=-= produces:
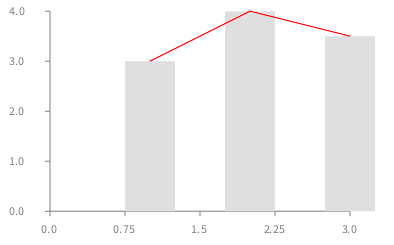
It is visually less appealing, however it works well when you combine it with other data sets: -=-=-=-=-=-= b := RTGrapher new.
d := RTData new. d points: #(3 4 3.5). d barShape. d noAlignmentOffset. b add: d.
d := RTData new. d points: #(3 4 3.5). d connectColor: Color red. b add: d.
b -=-=-=-=-=-=
This is committed in Pharo
Alexandre
On Oct 15, 2015, at 7:27 AM, Thomas Brodt thomas.brodt@porabo.ch wrote:
Hi Alexandre, hi Milton
today I upgraded to the new version 2.35 of Roassal for Visualworks. It gets better each time!
Unfortunately we have an issue with the new RTData. As the old RTStackedDataSet is obsolete now, we moved all our charts to RTData.
In some charts where we have bars mixed with lines, the dots of the line graph are no longer aligned with the center of the bars, as it was before with RTStackedDataSet. If I change the RTData for the line graph to RTStackedDataSet, the alignment works again.
Here is an example script:
| b ds | b := RTGrapher new. ds := RTData new. (ds barShape) width: 15; if: [:v | v < 0] fillColor: Color red; if: [:v | v > 0] fillColor: Color green. ds points: #(5 -6 10 20 -9). b add: ds.
ds := RTStackedDataSet new. ds points: #(4 -2 11 16 -10); connectColor: Color red; connect. ds dotShape color: Color blue. ds lineShape color: Color blue. b add: ds.
ds := RTData new. ds points: #(4 -2 11 16 -10); connectColor: Color red; connect. ds dotShape color: Color red. ds lineShape color: Color red. b add: ds.
(b axisX) noLabel; noTick. b axisY noDecimal. b build. b view
In the example, there are two lines with the same values, one using RTData, and one using RTStackedDataSet. And they have different positions, while I think they should be aligned.
Maybe you can have a look at that? Thanks,
Thomas

Hi,
On a related matter, there is any way to make axis be numbered according to the type of data, por example using integer data points will set the axis as integers (like in the first example) but adding a 3.5 will make the axis scale like is now. I don't know if this default makes sense (it does to me).
Cheers,
Offray
On 20/10/15 16:35, Alexandre Bergel wrote:
[NB: forwarded to the moose mailing list as other may be interested in this]
Hi Thomas,
This is a tricky situation, for which I have found a solution. Consider the script -=-=--=-=--=-=--=-=- b := RTGrapher new.
d := RTData new. d points: #(3 4 5). d barShape. b add: d.
b axisX noLabel; noTick. b -=-=--=-=--=-=--=-=-
produces
As always.
You can now send #noAlignmentOffset to the data to remove the offset.
b := RTGrapher new.
d := RTData new. d points: #(3 4 5). d barShape. d noAlignmentOffset. b add: d.
b axisX noLabel; noTick. b -=-=-=-=-=-= produces:
It is visually less appealing, however it works well when you combine it with other data sets: -=-=-=-=-=-= b := RTGrapher new.
d := RTData new. d points: #(3 4 3.5). d barShape. d noAlignmentOffset. b add: d.
d := RTData new. d points: #(3 4 3.5). d connectColor: Color red. b add: d.
b
This is committed in Pharo
Alexandre
On Oct 15, 2015, at 7:27 AM, Thomas Brodt <thomas.brodt@porabo.ch mailto:thomas.brodt@porabo.ch> wrote:
Hi Alexandre, hi Milton
today I upgraded to the new version 2.35 of Roassal for Visualworks. It gets better each time!
Unfortunately we have an issue with the new RTData. As the old RTStackedDataSet is obsolete now, we moved all our charts to RTData.
In some charts where we have bars mixed with lines, the dots of the line graph are no longer aligned with the center of the bars, as it was before with RTStackedDataSet. If I change the RTData for the line graph to RTStackedDataSet, the alignment works again.
Here is an example script:
| b ds | b := RTGrapher new. ds := RTData new. (ds barShape) width: 15; if: [:v | v < 0] fillColor: Color red; if: [:v | v > 0] fillColor: Color green. ds points: #(5 -6 10 20 -9). b add: ds.
ds := RTStackedDataSet new. ds points: #(4 -2 11 16 -10); connectColor: Color red; connect. ds dotShape color: Color blue. ds lineShape color: Color blue. b add: ds.
ds := RTData new. ds points: #(4 -2 11 16 -10); connectColor: Color red; connect. ds dotShape color: Color red. ds lineShape color: Color red. b add: ds.
(b axisX) noLabel; noTick. b axisY noDecimal. b build. b view
In the example, there are two lines with the same values, one using RTData, and one using RTStackedDataSet. And they have different positions, while I think they should be aligned.
Maybe you can have a look at that? Thanks,
Thomas
-- _,.;:~^~:;._,.;:~^~:;._,.;:~^~:;._,.;:~^~:;._,.;: Alexandre Bergel http://www.bergel.eu ^~:;._,.;:~^~:;._,.;:~^~:;._,.;:~^~:;._,.;:~^~:;.
Moose-dev mailing list Moose-dev@list.inf.unibe.ch https://www.list.inf.unibe.ch/listinfo/moose-dev
Hi Offray,
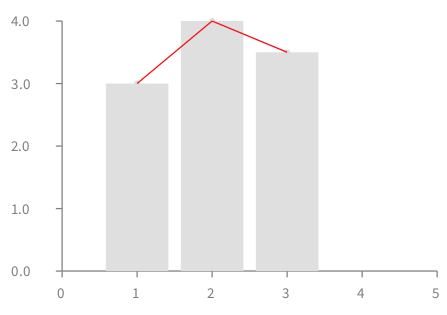
Sure, you can do: | b d | b := RTGrapher new.
d := RTData new. d points: #(3 4 3.5). d barShape. d noAlignmentOffset. b add: d.
d := RTData new. d points: #(3 4 3.5). d connectColor: Color red. b add: d.
b maxX: 5. b axisX numberOfLabels: 5; noDecimal. b
Excellent!
Alexandre
Le 21 oct. 2015 à 18:18, Offray Vladimir Luna Cárdenas offray@riseup.net a écrit :
Je je,
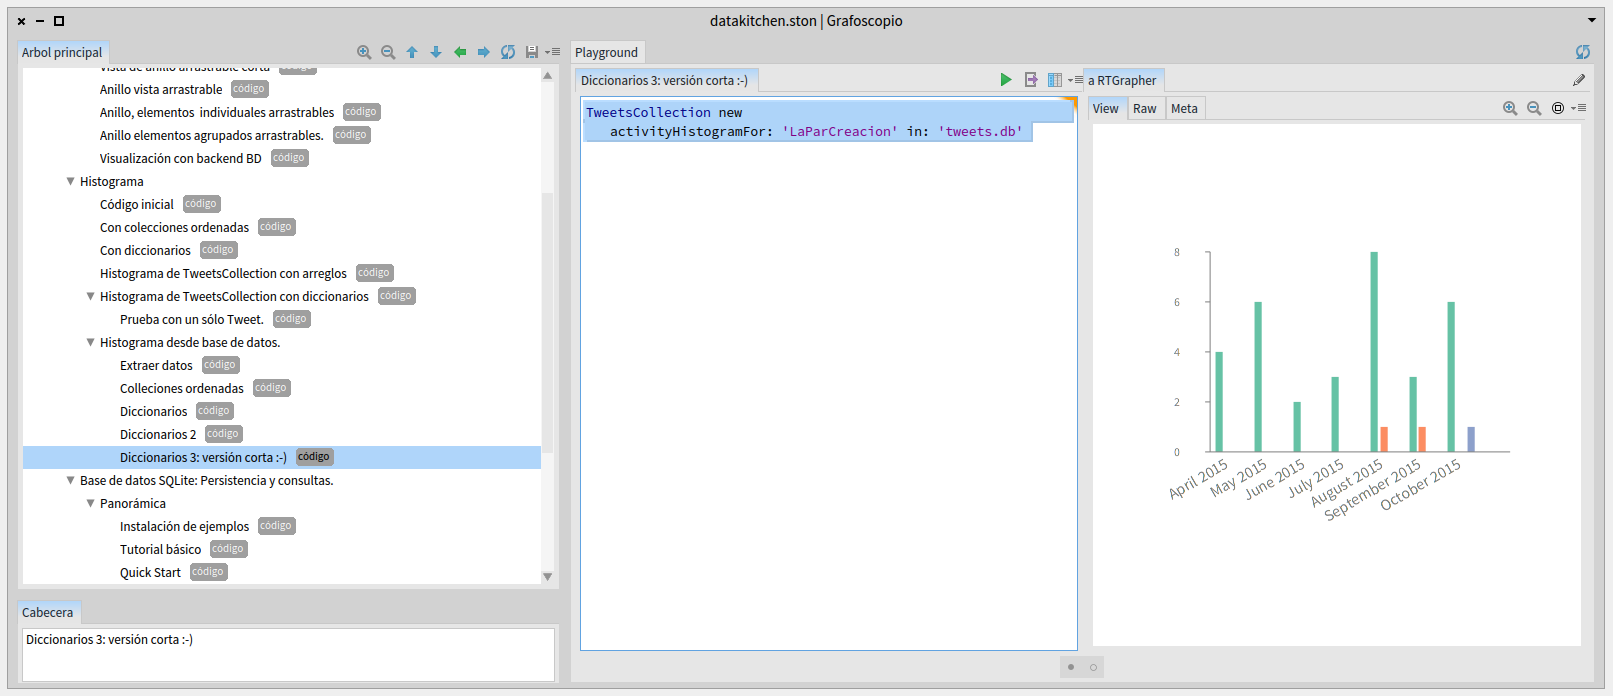
Pretty nice. Here is a grafoscopio screenshot of my last twitter scrapping data notebook:
Cheers,
Offray
On 21/10/15 15:55, Alexandre Bergel wrote: b axisX
Moose-dev mailing list Moose-dev@list.inf.unibe.ch https://www.list.inf.unibe.ch/listinfo/moose-dev
-
 Alexandre Bergel
 -
 Offray Vladimir Luna Cárdenas