
Hi guys!
It's been a while since I posted in this list.
The reason why I'm posting is because I finally finished my exams (yay!) and now I have some time to spare developing Graph-ET. I noticed a lot of you have been trying it, thank you for that :) I will try and answer all your questions regarding Graph-ET in the next few days.
Meanwhile, today I did a little work on Scatterplots, you can go play with that, here's an example for you:
| diag col | col := OrderedCollection new. col add: (1@1). col add: (1@2). col add: (2@1). col add: (2@2). col add: (0.75@0.5). col add: (0.6@1.5). diag := GETDiagramBuilder new. (diag scatterplot) models: col; x: [ :mod | mod x ]; y: [ :mod | mod y ]; regularAxis. diag open It's really pretty basic, I think changing the size and shape of he object should be nice. In ESUG I was working in animations, but I dropped it, I'll try again soon, but not inmediatly. Other things I think I'll work is improving the axis values in the labels and various customizations and bug-fixing.
Also, I would like to hear from you, what can I work on? I been recieving a lot of suggestions, and I'm glad. So if you have a request, doubt, complaint, comments or anything really you can contact me and I'll try and answer ASAP.
Hope hearing from you!Daniel

Hello,
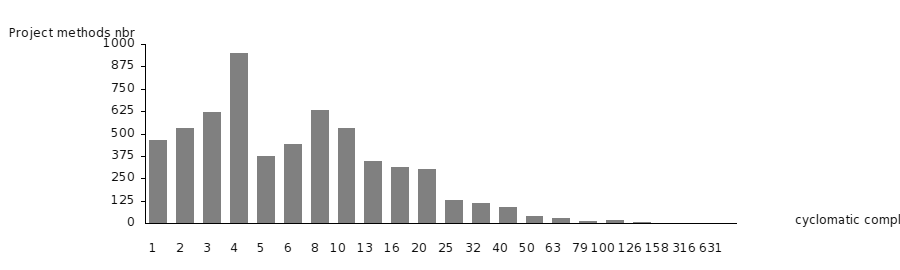
What you did is really great, and I need something like that, but I'm working with BarDiagrams actually. It would be perfect if we could use a point collection to get values on the X axis , but with no scale.
As you can see here, XAxis numbers are important but can't be scaled if we don't want to have some big holes in the middle of the diagram.
Thank you for being working on this. Kevin
----- Mail original -----
De: "Daniel Aviv Notario" daniel_avivnotario@hotmail.com À: moose-dev@iam.unibe.ch, pharo-dev@lists.pharo.org Envoyé: Jeudi 2 Janvier 2014 15:40:40 Objet: [Moose-dev] New in Graph-ET
Hi guys!
It's been a while since I posted in this list.
The reason why I'm posting is because I finally finished my exams (yay!) and now I have some time to spare developing Graph-ET. I noticed a lot of you have been trying it, thank you for that :) I will try and answer all your questions regarding Graph-ET in the next few days.
Meanwhile, today I did a little work on Scatterplots, you can go play with that, here's an example for you:
| diag col |
col := OrderedCollection new. col add: (1@1). col add: (1@2). col add: (2@1). col add: (2@2). col add: (0.75@0.5). col add: (0.6@1.5).
diag := GETDiagramBuilder new. (diag scatterplot) models: col; x: [ :mod | mod x ]; y: [ :mod | mod y ]; regularAxis.
diag open
It's really pretty basic, I think changing the size and shape of he object should be nice.
In ESUG I was working in animations, but I dropped it, I'll try again soon, but not inmediatly. Other things I think I'll work is improving the axis values in the labels and various customizations and bug-fixing.
Also, I would like to hear from you, what can I work on? I been recieving a lot of suggestions, and I'm glad. So if you have a request, doubt, complaint, comments or anything really you can contact me and I'll try and answer ASAP.
Hope hearing from you! Daniel _______________________________________________ Moose-dev mailing list Moose-dev@iam.unibe.ch https://www.iam.unibe.ch/mailman/listinfo/moose-dev

Hi daniele
Usman is on holidays and I’m sure that he has some ideas. For me I do not really need animation. To me it is orthogonal
I do not remember the feedback I gave you when I was visiting you now here is some: May be GraphET already does it if so ignore.
- What would be good is to check that you can express as least what Eyesee was doing. boxplot, ….. different shade of color overlay.
- Another point: it would be great to have a nice doc. We can pair write on a chapter together/with alex.
- it would be nice to see how we can plug a service like Kontraktor to write compress text
- Can we control the ticks spacing, height?
- can you control how the label of the axis is placed? - rotated - how far from the top …. I think that all the little details are important.
- how to support drill down. I see a chart how can I define interaction with its parts,
Did you have a look at the PlotMorph (it is rudimentary but it is fun).
On 02 Jan 2014, at 15:40, Daniel Aviv Notario daniel_avivnotario@hotmail.com wrote:
Hi guys!
It's been a while since I posted in this list.
The reason why I'm posting is because I finally finished my exams (yay!) and now I have some time to spare developing Graph-ET. I noticed a lot of you have been trying it, thank you for that :) I will try and answer all your questions regarding Graph-ET in the next few days.
Meanwhile, today I did a little work on Scatterplots, you can go play with that, here's an example for you:
| diag col |
col := OrderedCollection new. col add: (1@1). col add: (1@2). col add: (2@1). col add: (2@2). col add: (0.75@0.5). col add: (0.6@1.5).
diag := GETDiagramBuilder new. (diag scatterplot) models: col; x: [ :mod | mod x ]; y: [ :mod | mod y ]; regularAxis.
diag open
It's really pretty basic, I think changing the size and shape of he object should be nice.
In ESUG I was working in animations, but I dropped it, I'll try again soon, but not inmediatly. Other things I think I'll work is improving the axis values in the labels and various customizations and bug-fixing.
Also, I would like to hear from you, what can I work on? I been recieving a lot of suggestions, and I'm glad. So if you have a request, doubt, complaint, comments or anything really you can contact me and I'll try and answer ASAP.
Hope hearing from you! Daniel
-
 Daniel Aviv Notario
 -
 Kevin Lanvin
 -
 Stéphane Ducasse