
Reposting here, just in case you missed it :)
Doru
---------- Forwarded message ---------- From: Tudor Girba tudor@tudorgirba.com Date: Sat, Jan 4, 2014 at 10:39 PM Subject: Re: [Pharo-dev] Feature for request for GraphET? To: Pharo Development List pharo-dev@lists.pharo.org
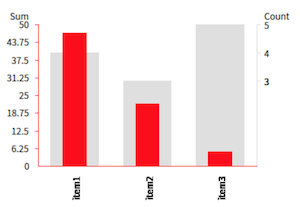
Here is one thing I would want: a correspondent Graph-ET functionality to make something like this EyeSee script work as in the first attached picture.
renderer := ESDiagramRenderer new. grouped := { #item1->{10 . 12 . 11 . 14 } . #item2-> { 1 . 1 . 20 } . #item3->{ 1 . 1 . 1 . 1 . 1} }. diag := (ESVerticalBarDiagram new) identifier: [:each | each key ]; y: [:each | each value size]; yAxisLabel: 'Count'; valueAxis; rightYAxis; defaultColor: Color veryVeryLightGray; axisColor: Color veryVeryLightGray; models: grouped; rotatedLabels: true; yourself. diag2 := (ESVerticalBarDiagram new) y: [:each | each value sum]; regularAxis; yAxisLabel: 'Sum'; gapFraction: 2 / 3; defaultColor: (Color red); axisColor: (Color red); models: grouped; yourself. (renderer compositeDiagram) add: diag; add: diag2. renderer open
[image: Inline image 2]
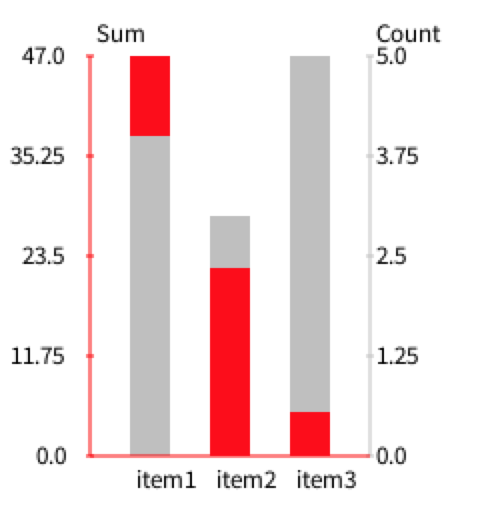
The best I could produce with Graph-ET is this (I commented out the message to which I did not find a correspondent):
builder := GETDiagramBuilder new. grouped := { #item1->{10 . 12 . 11 . 14 } . #item2-> { 1 . 1 . 20 } . #item3->{ 1 . 1 . 1 . 1 . 1} }. diag := (GETVerticalBarDiagram new) "identifier: [:each | each key ];" y: [:each | each value size]; yAxisLabel: 'Count'; valueAxisLine; "rightYAxis;" color: Color veryLightGray; "axisColor: Color veryLightGray;" models: grouped; "rotatedLabels: true;" yourself. diag2 := (GETVerticalBarDiagram new) y: [:each | each value sum]; regularAxis; yAxisLabel: 'Sum'; "gapFraction: 2 / 3;" color: (Color red); "axisColor: (Color red);" models: grouped; yourself. (builder compositeDiagram) add: diag; add: diag2. builder open
[image: Inline image 4]
Cheers, Doru
On Thu, Jan 2, 2014 at 7:24 PM, Alexandre Bergel alexandre.bergel@me.comwrote:
Hi!
Daniel is looking for usage scenarios with GraphET. It would be great to hear about your need. Currently, we will work on:
- PDF Export using Artefact
- support for legend
- smarter way to put labels on axis
Anything else?
Cheers, Alexandre -- _,.;:~^~:;._,.;:~^~:;._,.;:~^~:;._,.;:~^~:;._,.;: Alexandre Bergel http://www.bergel.eu ^~:;._,.;:~^~:;._,.;:~^~:;._,.;:~^~:;._,.;:~^~:;.

:-)
That will be the roadmap for week
Alexandre
On Jan 5, 2014, at 7:10 PM, Tudor Girba tudor@tudorgirba.com wrote:
Reposting here, just in case you missed it :)
Doru
---------- Forwarded message ---------- From: Tudor Girba tudor@tudorgirba.com Date: Sat, Jan 4, 2014 at 10:39 PM Subject: Re: [Pharo-dev] Feature for request for GraphET? To: Pharo Development List pharo-dev@lists.pharo.org
Here is one thing I would want: a correspondent Graph-ET functionality to make something like this EyeSee script work as in the first attached picture.
renderer := ESDiagramRenderer new. grouped := { #item1->{10 . 12 . 11 . 14 } . #item2-> { 1 . 1 . 20 } . #item3->{ 1 . 1 . 1 . 1 . 1} }. diag := (ESVerticalBarDiagram new) identifier: [:each | each key ]; y: [:each | each value size]; yAxisLabel: 'Count'; valueAxis; rightYAxis; defaultColor: Color veryVeryLightGray; axisColor: Color veryVeryLightGray; models: grouped; rotatedLabels: true; yourself. diag2 := (ESVerticalBarDiagram new) y: [:each | each value sum]; regularAxis; yAxisLabel: 'Sum'; gapFraction: 2 / 3; defaultColor: (Color red); axisColor: (Color red); models: grouped; yourself. (renderer compositeDiagram) add: diag; add: diag2. renderer open
<Screenshot 2014-01-04 22.31.57.png>
The best I could produce with Graph-ET is this (I commented out the message to which I did not find a correspondent):
builder := GETDiagramBuilder new. grouped := { #item1->{10 . 12 . 11 . 14 } . #item2-> { 1 . 1 . 20 } . #item3->{ 1 . 1 . 1 . 1 . 1} }. diag := (GETVerticalBarDiagram new) "identifier: [:each | each key ];" y: [:each | each value size]; yAxisLabel: 'Count'; valueAxisLine; "rightYAxis;" color: Color veryLightGray; "axisColor: Color veryLightGray;" models: grouped; "rotatedLabels: true;" yourself. diag2 := (GETVerticalBarDiagram new) y: [:each | each value sum]; regularAxis; yAxisLabel: 'Sum'; "gapFraction: 2 / 3;" color: (Color red); "axisColor: (Color red);" models: grouped; yourself. (builder compositeDiagram) add: diag; add: diag2. builder open
<Screenshot 2014-01-04 22.36.40.png>
Cheers, Doru
On Thu, Jan 2, 2014 at 7:24 PM, Alexandre Bergel alexandre.bergel@me.com wrote: Hi!
Daniel is looking for usage scenarios with GraphET. It would be great to hear about your need. Currently, we will work on:
- PDF Export using Artefact
- support for legend
- smarter way to put labels on axis
Anything else?
Cheers, Alexandre -- _,.;:~^~:;._,.;:~^~:;._,.;:~^~:;._,.;:~^~:;._,.;: Alexandre Bergel http://www.bergel.eu ^~:;._,.;:~^~:;._,.;:~^~:;._,.;:~^~:;._,.;:~^~:;.
-- www.tudorgirba.com
"Every thing has its own flow"
-- www.tudorgirba.com
"Every thing has its own flow" _______________________________________________ Moose-dev mailing list Moose-dev@iam.unibe.ch https://www.iam.unibe.ch/mailman/listinfo/moose-dev

Hello, I'm displaying a graph on the web , and it's working well, but then I want tu put a second diagram on my page. But diagrams are displayed in <div id="chart"></div> So i can't use a second division to display another one. Could it be possible to use class instead of id ?
----- Mail original -----
De: "Alexandre Bergel" alexandre.bergel@me.com À: "Moose-related development" moose-dev@iam.unibe.ch Envoyé: Lundi 6 Janvier 2014 02:16:48 Objet: [Moose-dev] Re: [Pharo-dev] Feature for request for GraphET?
:-)
That will be the roadmap for week
Alexandre
On Jan 5, 2014, at 7:10 PM, Tudor Girba tudor@tudorgirba.com wrote:
Reposting here, just in case you missed it :)
Doru
---------- Forwarded message ---------- From: Tudor Girba tudor@tudorgirba.com Date: Sat, Jan 4, 2014 at 10:39 PM Subject: Re: [Pharo-dev] Feature for request for GraphET? To: Pharo Development List pharo-dev@lists.pharo.org
Here is one thing I would want: a correspondent Graph-ET functionality to make something like this EyeSee script work as in the first attached picture.
renderer := ESDiagramRenderer new. grouped := { #item1->{10 . 12 . 11 . 14 } . #item2-> { 1 . 1 . 20 } . #item3->{ 1 . 1 . 1 . 1 . 1} }. diag := (ESVerticalBarDiagram new) identifier: [:each | each key ]; y: [:each | each value size]; yAxisLabel: 'Count'; valueAxis; rightYAxis; defaultColor: Color veryVeryLightGray; axisColor: Color veryVeryLightGray; models: grouped; rotatedLabels: true; yourself. diag2 := (ESVerticalBarDiagram new) y: [:each | each value sum]; regularAxis; yAxisLabel: 'Sum'; gapFraction: 2 / 3; defaultColor: (Color red); axisColor: (Color red); models: grouped; yourself. (renderer compositeDiagram) add: diag; add: diag2. renderer open
<Screenshot 2014-01-04 22.31.57.png>
The best I could produce with Graph-ET is this (I commented out the message to which I did not find a correspondent):
builder := GETDiagramBuilder new. grouped := { #item1->{10 . 12 . 11 . 14 } . #item2-> { 1 . 1 . 20 } . #item3->{ 1 . 1 . 1 . 1 . 1} }. diag := (GETVerticalBarDiagram new) "identifier: [:each | each key ];" y: [:each | each value size]; yAxisLabel: 'Count'; valueAxisLine; "rightYAxis;" color: Color veryLightGray; "axisColor: Color veryLightGray;" models: grouped; "rotatedLabels: true;" yourself. diag2 := (GETVerticalBarDiagram new) y: [:each | each value sum]; regularAxis; yAxisLabel: 'Sum'; "gapFraction: 2 / 3;" color: (Color red); "axisColor: (Color red);" models: grouped; yourself. (builder compositeDiagram) add: diag; add: diag2. builder open
<Screenshot 2014-01-04 22.36.40.png>
Cheers, Doru
On Thu, Jan 2, 2014 at 7:24 PM, Alexandre Bergel alexandre.bergel@me.com wrote: Hi!
Daniel is looking for usage scenarios with GraphET. It would be great to hear about your need. Currently, we will work on:
- PDF Export using Artefact
- support for legend
- smarter way to put labels on axis
Anything else?
Cheers, Alexandre -- _,.;:~^~:;._,.;:~^~:;._,.;:~^~:;._,.;:~^~:;._,.;: Alexandre Bergel http://www.bergel.eu ^~:;._,.;:~^~:;._,.;:~^~:;._,.;:~^~:;._,.;:~^~:;.
-- www.tudorgirba.com
"Every thing has its own flow"
-- www.tudorgirba.com
"Every thing has its own flow" _______________________________________________ Moose-dev mailing list Moose-dev@iam.unibe.ch https://www.iam.unibe.ch/mailman/listinfo/moose-dev
-- _,.;:~^~:;._,.;:~^~:;._,.;:~^~:;._,.;:~^~:;._,.;: Alexandre Bergel http://www.bergel.eu ^~:;._,.;:~^~:;._,.;:~^~:;._,.;:~^~:;._,.;:~^~:;.
Moose-dev mailing list Moose-dev@iam.unibe.ch https://www.iam.unibe.ch/mailman/listinfo/moose-dev
Sure! Feel free to provide a fix for this. Sending .st or .cs files is fine :-)
Alexandre
On Jan 6, 2014, at 11:29 AM, Kevin Lanvin kevin.lanvin@inria.fr wrote:
Hello, I'm displaying a graph on the web , and it's working well, but then I want tu put a second diagram on my page. But diagrams are displayed in <div id="chart"></div> So i can't use a second division to display another one. Could it be possible to use class instead of id ?
----- Mail original -----
De: "Alexandre Bergel" alexandre.bergel@me.com À: "Moose-related development" moose-dev@iam.unibe.ch Envoyé: Lundi 6 Janvier 2014 02:16:48 Objet: [Moose-dev] Re: [Pharo-dev] Feature for request for GraphET?
:-)
That will be the roadmap for week
Alexandre
On Jan 5, 2014, at 7:10 PM, Tudor Girba tudor@tudorgirba.com wrote:
Reposting here, just in case you missed it :)
Doru
---------- Forwarded message ---------- From: Tudor Girba tudor@tudorgirba.com Date: Sat, Jan 4, 2014 at 10:39 PM Subject: Re: [Pharo-dev] Feature for request for GraphET? To: Pharo Development List pharo-dev@lists.pharo.org
Here is one thing I would want: a correspondent Graph-ET functionality to make something like this EyeSee script work as in the first attached picture.
renderer := ESDiagramRenderer new. grouped := { #item1->{10 . 12 . 11 . 14 } . #item2-> { 1 . 1 . 20 } . #item3->{ 1 . 1 . 1 . 1 . 1} }. diag := (ESVerticalBarDiagram new) identifier: [:each | each key ]; y: [:each | each value size]; yAxisLabel: 'Count'; valueAxis; rightYAxis; defaultColor: Color veryVeryLightGray; axisColor: Color veryVeryLightGray; models: grouped; rotatedLabels: true; yourself. diag2 := (ESVerticalBarDiagram new) y: [:each | each value sum]; regularAxis; yAxisLabel: 'Sum'; gapFraction: 2 / 3; defaultColor: (Color red); axisColor: (Color red); models: grouped; yourself. (renderer compositeDiagram) add: diag; add: diag2. renderer open
<Screenshot 2014-01-04 22.31.57.png>
The best I could produce with Graph-ET is this (I commented out the message to which I did not find a correspondent):
builder := GETDiagramBuilder new. grouped := { #item1->{10 . 12 . 11 . 14 } . #item2-> { 1 . 1 . 20 } . #item3->{ 1 . 1 . 1 . 1 . 1} }. diag := (GETVerticalBarDiagram new) "identifier: [:each | each key ];" y: [:each | each value size]; yAxisLabel: 'Count'; valueAxisLine; "rightYAxis;" color: Color veryLightGray; "axisColor: Color veryLightGray;" models: grouped; "rotatedLabels: true;" yourself. diag2 := (GETVerticalBarDiagram new) y: [:each | each value sum]; regularAxis; yAxisLabel: 'Sum'; "gapFraction: 2 / 3;" color: (Color red); "axisColor: (Color red);" models: grouped; yourself. (builder compositeDiagram) add: diag; add: diag2. builder open
<Screenshot 2014-01-04 22.36.40.png>
Cheers, Doru
On Thu, Jan 2, 2014 at 7:24 PM, Alexandre Bergel alexandre.bergel@me.com wrote: Hi!
Daniel is looking for usage scenarios with GraphET. It would be great to hear about your need. Currently, we will work on:
- PDF Export using Artefact
- support for legend
- smarter way to put labels on axis
Anything else?
Cheers, Alexandre -- _,.;:~^~:;._,.;:~^~:;._,.;:~^~:;._,.;:~^~:;._,.;: Alexandre Bergel http://www.bergel.eu ^~:;._,.;:~^~:;._,.;:~^~:;._,.;:~^~:;._,.;:~^~:;.
-- www.tudorgirba.com
"Every thing has its own flow"
-- www.tudorgirba.com
"Every thing has its own flow" _______________________________________________ Moose-dev mailing list Moose-dev@iam.unibe.ch https://www.iam.unibe.ch/mailman/listinfo/moose-dev
-- _,.;:~^~:;._,.;:~^~:;._,.;:~^~:;._,.;:~^~:;._,.;: Alexandre Bergel http://www.bergel.eu ^~:;._,.;:~^~:;._,.;:~^~:;._,.;:~^~:;._,.;:~^~:;.
Moose-dev mailing list Moose-dev@iam.unibe.ch https://www.iam.unibe.ch/mailman/listinfo/moose-dev
Moose-dev mailing list Moose-dev@iam.unibe.ch https://www.iam.unibe.ch/mailman/listinfo/moose-dev
I'm not able to do it myself. I've never done javascript before and I think the problem is coming from here. I'm sorry to ask you so much with graph-ET.
----- Mail original -----
De: "Alexandre Bergel" alexandre.bergel@me.com À: "Moose-related development" moose-dev@iam.unibe.ch Envoyé: Lundi 6 Janvier 2014 16:06:26 Objet: [Moose-dev] Re: [Pharo-dev] Feature for request for GraphET?
Sure! Feel free to provide a fix for this. Sending .st or .cs files is fine :-)
Alexandre
On Jan 6, 2014, at 11:29 AM, Kevin Lanvin kevin.lanvin@inria.fr wrote:
Hello, I'm displaying a graph on the web , and it's working well, but then I want tu put a second diagram on my page. But diagrams are displayed in <div id="chart"></div> So i can't use a second division to display another one. Could it be possible to use class instead of id ?
----- Mail original -----
De: "Alexandre Bergel" alexandre.bergel@me.com À: "Moose-related development" moose-dev@iam.unibe.ch Envoyé: Lundi 6 Janvier 2014 02:16:48 Objet: [Moose-dev] Re: [Pharo-dev] Feature for request for GraphET?
:-)
That will be the roadmap for week
Alexandre
On Jan 5, 2014, at 7:10 PM, Tudor Girba tudor@tudorgirba.com wrote:
Reposting here, just in case you missed it :)
Doru
---------- Forwarded message ---------- From: Tudor Girba tudor@tudorgirba.com Date: Sat, Jan 4, 2014 at 10:39 PM Subject: Re: [Pharo-dev] Feature for request for GraphET? To: Pharo Development List pharo-dev@lists.pharo.org
Here is one thing I would want: a correspondent Graph-ET functionality to make something like this EyeSee script work as in the first attached picture.
renderer := ESDiagramRenderer new. grouped := { #item1->{10 . 12 . 11 . 14 } . #item2-> { 1 . 1 . 20 } . #item3->{ 1 . 1 . 1 . 1 . 1} }. diag := (ESVerticalBarDiagram new) identifier: [:each | each key ]; y: [:each | each value size]; yAxisLabel: 'Count'; valueAxis; rightYAxis; defaultColor: Color veryVeryLightGray; axisColor: Color veryVeryLightGray; models: grouped; rotatedLabels: true; yourself. diag2 := (ESVerticalBarDiagram new) y: [:each | each value sum]; regularAxis; yAxisLabel: 'Sum'; gapFraction: 2 / 3; defaultColor: (Color red); axisColor: (Color red); models: grouped; yourself. (renderer compositeDiagram) add: diag; add: diag2. renderer open
<Screenshot 2014-01-04 22.31.57.png>
The best I could produce with Graph-ET is this (I commented out the message to which I did not find a correspondent):
builder := GETDiagramBuilder new. grouped := { #item1->{10 . 12 . 11 . 14 } . #item2-> { 1 . 1 . 20 } . #item3->{ 1 . 1 . 1 . 1 . 1} }. diag := (GETVerticalBarDiagram new) "identifier: [:each | each key ];" y: [:each | each value size]; yAxisLabel: 'Count'; valueAxisLine; "rightYAxis;" color: Color veryLightGray; "axisColor: Color veryLightGray;" models: grouped; "rotatedLabels: true;" yourself. diag2 := (GETVerticalBarDiagram new) y: [:each | each value sum]; regularAxis; yAxisLabel: 'Sum'; "gapFraction: 2 / 3;" color: (Color red); "axisColor: (Color red);" models: grouped; yourself. (builder compositeDiagram) add: diag; add: diag2. builder open
<Screenshot 2014-01-04 22.36.40.png>
Cheers, Doru
On Thu, Jan 2, 2014 at 7:24 PM, Alexandre Bergel alexandre.bergel@me.com wrote: Hi!
Daniel is looking for usage scenarios with GraphET. It would be great to hear about your need. Currently, we will work on:
- PDF Export using Artefact
- support for legend
- smarter way to put labels on axis
Anything else?
Cheers, Alexandre -- _,.;:~^~:;._,.;:~^~:;._,.;:~^~:;._,.;:~^~:;._,.;: Alexandre Bergel http://www.bergel.eu ^~:;._,.;:~^~:;._,.;:~^~:;._,.;:~^~:;._,.;:~^~:;.
-- www.tudorgirba.com
"Every thing has its own flow"
-- www.tudorgirba.com
"Every thing has its own flow" _______________________________________________ Moose-dev mailing list Moose-dev@iam.unibe.ch https://www.iam.unibe.ch/mailman/listinfo/moose-dev
-- _,.;:~^~:;._,.;:~^~:;._,.;:~^~:;._,.;:~^~:;._,.;: Alexandre Bergel http://www.bergel.eu ^~:;._,.;:~^~:;._,.;:~^~:;._,.;:~^~:;._,.;:~^~:;.
Moose-dev mailing list Moose-dev@iam.unibe.ch https://www.iam.unibe.ch/mailman/listinfo/moose-dev
Moose-dev mailing list Moose-dev@iam.unibe.ch https://www.iam.unibe.ch/mailman/listinfo/moose-dev
-- _,.;:~^~:;._,.;:~^~:;._,.;:~^~:;._,.;:~^~:;._,.;: Alexandre Bergel http://www.bergel.eu ^~:;._,.;:~^~:;._,.;:~^~:;._,.;:~^~:;._,.;:~^~:;.
Moose-dev mailing list Moose-dev@iam.unibe.ch https://www.iam.unibe.ch/mailman/listinfo/moose-dev

Nonesense! It's a preasure to having you asking us thing in Graph-ET, that just means you're using it, and it's cool :)
Date: Mon, 6 Jan 2014 16:42:14 +0100 From: kevin.lanvin@inria.fr To: moose-dev@iam.unibe.ch Subject: [Moose-dev] Re: [Pharo-dev] Feature for request for GraphET?
I'm not able to do it myself. I've never done javascript before and I think the problem is coming from here. I'm sorry to ask you so much with graph-ET.
----- Mail original -----
De: "Alexandre Bergel" alexandre.bergel@me.com À: "Moose-related development" moose-dev@iam.unibe.ch Envoyé: Lundi 6 Janvier 2014 16:06:26 Objet: [Moose-dev] Re: [Pharo-dev] Feature for request for GraphET?
Sure! Feel free to provide a fix for this. Sending .st or .cs files is fine :-)
Alexandre
On Jan 6, 2014, at 11:29 AM, Kevin Lanvin kevin.lanvin@inria.fr wrote:
Hello, I'm displaying a graph on the web , and it's working well, but then I want tu put a second diagram on my page. But diagrams are displayed in <div id="chart"></div> So i can't use a second division to display another one. Could it be possible to use class instead of id ?
----- Mail original -----
De: "Alexandre Bergel" alexandre.bergel@me.com À: "Moose-related development" moose-dev@iam.unibe.ch Envoyé: Lundi 6 Janvier 2014 02:16:48 Objet: [Moose-dev] Re: [Pharo-dev] Feature for request for GraphET?
:-)
That will be the roadmap for week
Alexandre
On Jan 5, 2014, at 7:10 PM, Tudor Girba tudor@tudorgirba.com wrote:
Reposting here, just in case you missed it :)
Doru
---------- Forwarded message ---------- From: Tudor Girba tudor@tudorgirba.com Date: Sat, Jan 4, 2014 at 10:39 PM Subject: Re: [Pharo-dev] Feature for request for GraphET? To: Pharo Development List pharo-dev@lists.pharo.org
Here is one thing I would want: a correspondent Graph-ET functionality to make something like this EyeSee script work as in the first attached picture.
renderer := ESDiagramRenderer new. grouped := { #item1->{10 . 12 . 11 . 14 } . #item2-> { 1 . 1 . 20 } . #item3->{ 1 . 1 . 1 . 1 . 1} }. diag := (ESVerticalBarDiagram new) identifier: [:each | each key ]; y: [:each | each value size]; yAxisLabel: 'Count'; valueAxis; rightYAxis; defaultColor: Color veryVeryLightGray; axisColor: Color veryVeryLightGray; models: grouped; rotatedLabels: true; yourself. diag2 := (ESVerticalBarDiagram new) y: [:each | each value sum]; regularAxis; yAxisLabel: 'Sum'; gapFraction: 2 / 3; defaultColor: (Color red); axisColor: (Color red); models: grouped; yourself. (renderer compositeDiagram) add: diag; add: diag2. renderer open
<Screenshot 2014-01-04 22.31.57.png>
The best I could produce with Graph-ET is this (I commented out the message to which I did not find a correspondent):
builder := GETDiagramBuilder new. grouped := { #item1->{10 . 12 . 11 . 14 } . #item2-> { 1 . 1 . 20 } . #item3->{ 1 . 1 . 1 . 1 . 1} }. diag := (GETVerticalBarDiagram new) "identifier: [:each | each key ];" y: [:each | each value size]; yAxisLabel: 'Count'; valueAxisLine; "rightYAxis;" color: Color veryLightGray; "axisColor: Color veryLightGray;" models: grouped; "rotatedLabels: true;" yourself. diag2 := (GETVerticalBarDiagram new) y: [:each | each value sum]; regularAxis; yAxisLabel: 'Sum'; "gapFraction: 2 / 3;" color: (Color red); "axisColor: (Color red);" models: grouped; yourself. (builder compositeDiagram) add: diag; add: diag2. builder open
<Screenshot 2014-01-04 22.36.40.png>
Cheers, Doru
On Thu, Jan 2, 2014 at 7:24 PM, Alexandre Bergel alexandre.bergel@me.com wrote: Hi!
Daniel is looking for usage scenarios with GraphET. It would be great to hear about your need. Currently, we will work on:
- PDF Export using Artefact
- support for legend
- smarter way to put labels on axis
Anything else?
Cheers, Alexandre -- _,.;:~^~:;._,.;:~^~:;._,.;:~^~:;._,.;:~^~:;._,.;: Alexandre Bergel http://www.bergel.eu ^~:;._,.;:~^~:;._,.;:~^~:;._,.;:~^~:;._,.;:~^~:;.
-- www.tudorgirba.com
"Every thing has its own flow"
-- www.tudorgirba.com
"Every thing has its own flow" _______________________________________________ Moose-dev mailing list Moose-dev@iam.unibe.ch https://www.iam.unibe.ch/mailman/listinfo/moose-dev
-- _,.;:~^~:;._,.;:~^~:;._,.;:~^~:;._,.;:~^~:;._,.;: Alexandre Bergel http://www.bergel.eu ^~:;._,.;:~^~:;._,.;:~^~:;._,.;:~^~:;._,.;:~^~:;.
Moose-dev mailing list Moose-dev@iam.unibe.ch https://www.iam.unibe.ch/mailman/listinfo/moose-dev
Moose-dev mailing list Moose-dev@iam.unibe.ch https://www.iam.unibe.ch/mailman/listinfo/moose-dev
-- _,.;:~^~:;._,.;:~^~:;._,.;:~^~:;._,.;:~^~:;._,.;: Alexandre Bergel http://www.bergel.eu ^~:;._,.;:~^~:;._,.;:~^~:;._,.;:~^~:;._,.;:~^~:;.
Moose-dev mailing list Moose-dev@iam.unibe.ch https://www.iam.unibe.ch/mailman/listinfo/moose-dev
Moose-dev mailing list Moose-dev@iam.unibe.ch https://www.iam.unibe.ch/mailman/listinfo/moose-dev
Doru, I'm working on that example, I can replicate a little bit more that you could, but definitly I can't replicate all of the ES diagram, I'm working on it right now. I'll inform you as soon as I get any result.
Cheers! Daniel
Date: Mon, 6 Jan 2014 16:42:14 +0100 From: kevin.lanvin@inria.fr To: moose-dev@iam.unibe.ch Subject: [Moose-dev] Re: [Pharo-dev] Feature for request for GraphET?
I'm not able to do it myself. I've never done javascript before and I think the problem is coming from here. I'm sorry to ask you so much with graph-ET.
----- Mail original -----
De: "Alexandre Bergel" alexandre.bergel@me.com À: "Moose-related development" moose-dev@iam.unibe.ch Envoyé: Lundi 6 Janvier 2014 16:06:26 Objet: [Moose-dev] Re: [Pharo-dev] Feature for request for GraphET?
Sure! Feel free to provide a fix for this. Sending .st or .cs files is fine :-)
Alexandre
On Jan 6, 2014, at 11:29 AM, Kevin Lanvin kevin.lanvin@inria.fr wrote:
Hello, I'm displaying a graph on the web , and it's working well, but then I want tu put a second diagram on my page. But diagrams are displayed in <div id="chart"></div> So i can't use a second division to display another one. Could it be possible to use class instead of id ?
----- Mail original -----
De: "Alexandre Bergel" alexandre.bergel@me.com À: "Moose-related development" moose-dev@iam.unibe.ch Envoyé: Lundi 6 Janvier 2014 02:16:48 Objet: [Moose-dev] Re: [Pharo-dev] Feature for request for GraphET?
:-)
That will be the roadmap for week
Alexandre
On Jan 5, 2014, at 7:10 PM, Tudor Girba tudor@tudorgirba.com wrote:
Reposting here, just in case you missed it :)
Doru
---------- Forwarded message ---------- From: Tudor Girba tudor@tudorgirba.com Date: Sat, Jan 4, 2014 at 10:39 PM Subject: Re: [Pharo-dev] Feature for request for GraphET? To: Pharo Development List pharo-dev@lists.pharo.org
Here is one thing I would want: a correspondent Graph-ET functionality to make something like this EyeSee script work as in the first attached picture.
renderer := ESDiagramRenderer new. grouped := { #item1->{10 . 12 . 11 . 14 } . #item2-> { 1 . 1 . 20 } . #item3->{ 1 . 1 . 1 . 1 . 1} }. diag := (ESVerticalBarDiagram new) identifier: [:each | each key ]; y: [:each | each value size]; yAxisLabel: 'Count'; valueAxis; rightYAxis; defaultColor: Color veryVeryLightGray; axisColor: Color veryVeryLightGray; models: grouped; rotatedLabels: true; yourself. diag2 := (ESVerticalBarDiagram new) y: [:each | each value sum]; regularAxis; yAxisLabel: 'Sum'; gapFraction: 2 / 3; defaultColor: (Color red); axisColor: (Color red); models: grouped; yourself. (renderer compositeDiagram) add: diag; add: diag2. renderer open
<Screenshot 2014-01-04 22.31.57.png>
The best I could produce with Graph-ET is this (I commented out the message to which I did not find a correspondent):
builder := GETDiagramBuilder new. grouped := { #item1->{10 . 12 . 11 . 14 } . #item2-> { 1 . 1 . 20 } . #item3->{ 1 . 1 . 1 . 1 . 1} }. diag := (GETVerticalBarDiagram new) "identifier: [:each | each key ];" y: [:each | each value size]; yAxisLabel: 'Count'; valueAxisLine; "rightYAxis;" color: Color veryLightGray; "axisColor: Color veryLightGray;" models: grouped; "rotatedLabels: true;" yourself. diag2 := (GETVerticalBarDiagram new) y: [:each | each value sum]; regularAxis; yAxisLabel: 'Sum'; "gapFraction: 2 / 3;" color: (Color red); "axisColor: (Color red);" models: grouped; yourself. (builder compositeDiagram) add: diag; add: diag2. builder open
<Screenshot 2014-01-04 22.36.40.png>
Cheers, Doru
On Thu, Jan 2, 2014 at 7:24 PM, Alexandre Bergel alexandre.bergel@me.com wrote: Hi!
Daniel is looking for usage scenarios with GraphET. It would be great to hear about your need. Currently, we will work on:
- PDF Export using Artefact
- support for legend
- smarter way to put labels on axis
Anything else?
Cheers, Alexandre -- _,.;:~^~:;._,.;:~^~:;._,.;:~^~:;._,.;:~^~:;._,.;: Alexandre Bergel http://www.bergel.eu ^~:;._,.;:~^~:;._,.;:~^~:;._,.;:~^~:;._,.;:~^~:;.
-- www.tudorgirba.com
"Every thing has its own flow"
-- www.tudorgirba.com
"Every thing has its own flow" _______________________________________________ Moose-dev mailing list Moose-dev@iam.unibe.ch https://www.iam.unibe.ch/mailman/listinfo/moose-dev
-- _,.;:~^~:;._,.;:~^~:;._,.;:~^~:;._,.;:~^~:;._,.;: Alexandre Bergel http://www.bergel.eu ^~:;._,.;:~^~:;._,.;:~^~:;._,.;:~^~:;._,.;:~^~:;.
Moose-dev mailing list Moose-dev@iam.unibe.ch https://www.iam.unibe.ch/mailman/listinfo/moose-dev
Moose-dev mailing list Moose-dev@iam.unibe.ch https://www.iam.unibe.ch/mailman/listinfo/moose-dev
-- _,.;:~^~:;._,.;:~^~:;._,.;:~^~:;._,.;:~^~:;._,.;: Alexandre Bergel http://www.bergel.eu ^~:;._,.;:~^~:;._,.;:~^~:;._,.;:~^~:;._,.;:~^~:;.
Moose-dev mailing list Moose-dev@iam.unibe.ch https://www.iam.unibe.ch/mailman/listinfo/moose-dev
Moose-dev mailing list Moose-dev@iam.unibe.ch https://www.iam.unibe.ch/mailman/listinfo/moose-dev
_______________________________________________ Moose-dev mailing list Moose-dev@iam.unibe.ch https://www.iam.unibe.ch/mailman/listinfo/moose-dev
Excellent, Daniel. Please let me know when I can review code.
Doru
On Mon, Jan 6, 2014 at 7:02 PM, Daniel Aviv Notario < daniel_avivnotario@hotmail.com> wrote:
Doru, I'm working on that example, I can replicate a little bit more that you could, but definitly I can't replicate all of the ES diagram, I'm working on it right now. I'll inform you as soon as I get any result.
Cheers! Daniel
Date: Mon, 6 Jan 2014 16:42:14 +0100 From: kevin.lanvin@inria.fr To: moose-dev@iam.unibe.ch Subject: [Moose-dev] Re: [Pharo-dev] Feature for request for GraphET?
I'm not able to do it myself. I've never done javascript before and I
think the problem is coming from here.
I'm sorry to ask you so much with graph-ET.
----- Mail original -----
De: "Alexandre Bergel" alexandre.bergel@me.com À: "Moose-related development" moose-dev@iam.unibe.ch Envoyé: Lundi 6 Janvier 2014 16:06:26 Objet: [Moose-dev] Re: [Pharo-dev] Feature for request for GraphET?
Sure! Feel free to provide a fix for this. Sending .st or .cs files is fine :-)
Alexandre
On Jan 6, 2014, at 11:29 AM, Kevin Lanvin kevin.lanvin@inria.fr wrote:
Hello, I'm displaying a graph on the web , and it's working well, but then I want tu put a second diagram on my page. But diagrams are displayed in <div id="chart"></div> So i can't use a second division to display another one. Could it be possible to use class instead of id ?
----- Mail original -----
De: "Alexandre Bergel" alexandre.bergel@me.com À: "Moose-related development" moose-dev@iam.unibe.ch Envoyé: Lundi 6 Janvier 2014 02:16:48 Objet: [Moose-dev] Re: [Pharo-dev] Feature for request for GraphET?
:-)
That will be the roadmap for week
Alexandre
On Jan 5, 2014, at 7:10 PM, Tudor Girba tudor@tudorgirba.com wrote:
Reposting here, just in case you missed it :)
Doru
---------- Forwarded message ---------- From: Tudor Girba tudor@tudorgirba.com Date: Sat, Jan 4, 2014 at 10:39 PM Subject: Re: [Pharo-dev] Feature for request for GraphET? To: Pharo Development List pharo-dev@lists.pharo.org
Here is one thing I would want: a correspondent Graph-ET functionality to make something like this EyeSee script work as in the first attached picture.
renderer := ESDiagramRenderer new. grouped := { #item1->{10 . 12 . 11 . 14 } . #item2-> { 1 . 1 . 20 } . #item3->{ 1 . 1 . 1 . 1 . 1} }. diag := (ESVerticalBarDiagram new) identifier: [:each | each key ]; y: [:each | each value size]; yAxisLabel: 'Count'; valueAxis; rightYAxis; defaultColor: Color veryVeryLightGray; axisColor: Color veryVeryLightGray; models: grouped; rotatedLabels: true; yourself. diag2 := (ESVerticalBarDiagram new) y: [:each | each value sum]; regularAxis; yAxisLabel: 'Sum'; gapFraction: 2 / 3; defaultColor: (Color red); axisColor: (Color red); models: grouped; yourself. (renderer compositeDiagram) add: diag; add: diag2. renderer open
<Screenshot 2014-01-04 22.31.57.png>
The best I could produce with Graph-ET is this (I commented out the message to which I did not find a correspondent):
builder := GETDiagramBuilder new. grouped := { #item1->{10 . 12 . 11 . 14 } . #item2-> { 1 . 1 . 20 } . #item3->{ 1 . 1 . 1 . 1 . 1} }. diag := (GETVerticalBarDiagram new) "identifier: [:each | each key ];" y: [:each | each value size]; yAxisLabel: 'Count'; valueAxisLine; "rightYAxis;" color: Color veryLightGray; "axisColor: Color veryLightGray;" models: grouped; "rotatedLabels: true;" yourself. diag2 := (GETVerticalBarDiagram new) y: [:each | each value sum]; regularAxis; yAxisLabel: 'Sum'; "gapFraction: 2 / 3;" color: (Color red); "axisColor: (Color red);" models: grouped; yourself. (builder compositeDiagram) add: diag; add: diag2. builder open
<Screenshot 2014-01-04 22.36.40.png>
Cheers, Doru
On Thu, Jan 2, 2014 at 7:24 PM, Alexandre Bergel alexandre.bergel@me.com wrote: Hi!
Daniel is looking for usage scenarios with GraphET. It would be great to hear about your need. Currently, we will work on:
- PDF Export using Artefact
- support for legend
- smarter way to put labels on axis
Anything else?
Cheers, Alexandre -- _,.;:~^~:;._,.;:~^~:;._,.;:~^~:;._,.;:~^~:;._,.;: Alexandre Bergel http://www.bergel.eu ^~:;._,.;:~^~:;._,.;:~^~:;._,.;:~^~:;._,.;:~^~:;.
-- www.tudorgirba.com
"Every thing has its own flow"
-- www.tudorgirba.com
"Every thing has its own flow" _______________________________________________ Moose-dev mailing list Moose-dev@iam.unibe.ch https://www.iam.unibe.ch/mailman/listinfo/moose-dev
-- _,.;:~^~:;._,.;:~^~:;._,.;:~^~:;._,.;:~^~:;._,.;: Alexandre Bergel http://www.bergel.eu ^~:;._,.;:~^~:;._,.;:~^~:;._,.;:~^~:;._,.;:~^~:;.
Moose-dev mailing list Moose-dev@iam.unibe.ch https://www.iam.unibe.ch/mailman/listinfo/moose-dev
Moose-dev mailing list Moose-dev@iam.unibe.ch https://www.iam.unibe.ch/mailman/listinfo/moose-dev
-- _,.;:~^~:;._,.;:~^~:;._,.;:~^~:;._,.;:~^~:;._,.;: Alexandre Bergel http://www.bergel.eu ^~:;._,.;:~^~:;._,.;:~^~:;._,.;:~^~:;._,.;:~^~:;.
Moose-dev mailing list Moose-dev@iam.unibe.ch https://www.iam.unibe.ch/mailman/listinfo/moose-dev
Moose-dev mailing list Moose-dev@iam.unibe.ch https://www.iam.unibe.ch/mailman/listinfo/moose-dev
_______________________________________________ Moose-dev mailing list Moose-dev@iam.unibe.ch https://www.iam.unibe.ch/mailman/listinfo/moose-dev
Moose-dev mailing list Moose-dev@iam.unibe.ch https://www.iam.unibe.ch/mailman/listinfo/moose-dev
So, attending to the request Doru made, here's something similar to the example he provided in EyeSee... All the methods were already implemented but most of them didn't have a clear accesor to modify them. So, if you just load the last version of GraphET and do this:
builder := GETDiagramBuilder new. grouped := { #item1->{10 . 12 . 11 . 14 } . #item2-> { 1 . 1 . 20 } . #item3->{ 1 . 1 . 1 . 1 . 1} }. diag := (GETVerticalBarDiagram new) modelLabels: [:each | each key ]; y: [:each | each value size]; yAxisLabel: 'Count'; valueAxis;height:200;spacing:20; yAxisOnRight; color: Color veryLightGray; axisColor: Color veryLightGray; models: grouped; yourself. diag2 := (GETVerticalBarDiagram new) y: [:each | each value sum]; regularAxis;height: 200;spacing:20;yAxisLabel: 'Sum';color: (Color red); axisColor: (Color red); models: grouped; yourself. (builder unionDiagram) add: diag;add: diag2. builder open
You'll see it's very similar. There's two things I couldn't replicate so far, one of them is the rotating labels, as Roassal can't rotate labels yet, and the second one was the GapFraction, as axis in GraphET need some work yet, so implementing that kind of thing would be hard. I think I'll dedicate to a proper axis in the next couple of weeks. Cheers :)!
---------- Forwarded message ---------- From: Tudor Girba tudor@tudorgirba.com Date: Sat, Jan 4, 2014 at 10:39 PM Subject: Re: [Pharo-dev] Feature for request for GraphET? To: Pharo Development List pharo-dev@lists.pharo.org
Here is one thing I would want: a correspondent Graph-ET functionality to make something like this EyeSee script work as in the first attached picture.
renderer := ESDiagramRenderer new. grouped := { #item1->{10 . 12 . 11 . 14 } . #item2-> { 1 . 1 . 20 } . #item3->{ 1 . 1 . 1 . 1 . 1} }. diag := (ESVerticalBarDiagram new) identifier: [:each | each key ]; y: [:each | each value size]; yAxisLabel: 'Count'; valueAxis; rightYAxis; defaultColor: Color veryVeryLightGray; axisColor: Color veryVeryLightGray; models: grouped; rotatedLabels: true; yourself. diag2 := (ESVerticalBarDiagram new) y: [:each | each value sum]; regularAxis; yAxisLabel: 'Sum'; gapFraction: 2 / 3; defaultColor: (Color red); axisColor: (Color red); models: grouped; yourself. (renderer compositeDiagram) add: diag; add: diag2. renderer open
<Screenshot 2014-01-04 22.31.57.png>
The best I could produce with Graph-ET is this (I commented out the message to which I did not find a correspondent):
builder := GETDiagramBuilder new. grouped := { #item1->{10 . 12 . 11 . 14 } . #item2-> { 1 . 1 . 20 } . #item3->{ 1 . 1 . 1 . 1 . 1} }. diag := (GETVerticalBarDiagram new) "identifier: [:each | each key ];" y: [:each | each value size]; yAxisLabel: 'Count'; valueAxisLine; "rightYAxis;" color: Color veryLightGray; "axisColor: Color veryLightGray;" models: grouped; "rotatedLabels: true;" yourself. diag2 := (GETVerticalBarDiagram new) y: [:each | each value sum]; regularAxis; yAxisLabel: 'Sum'; "gapFraction: 2 / 3;" color: (Color red); "axisColor: (Color red);" models: grouped; yourself. (builder compositeDiagram) add: diag; add: diag2. builder open
<Screenshot 2014-01-04 22.36.40.png>
Cheers, Doru
Hi Daniel,
Good work!
But, there is still something I do not quite understand. Take a look at the produced image. Why is it that in the first red bar appears behind the gray one, and the rest appear in front of the corresponding gray bars?
Related to the GapFraction: Could you describe what makes it such an expensive issue to compute the width of the bar with a bit of scaling? I am asking because this particular diagram does not work without it.
Cheers, Doru
[image: Inline image 1]
On Wed, Jan 8, 2014 at 6:50 PM, Daniel Aviv Notario < daniel_avivnotario@hotmail.com> wrote:
So, attending to the request Doru made, here's something similar to the example he provided in EyeSee... All the methods were already implemented but most of them didn't have a clear accesor to modify them.
So, if you just load the last version of GraphET and do this:
builder := GETDiagramBuilder new. grouped := { #item1->{10 . 12 . 11 . 14 } . #item2-> { 1 . 1 . 20 } . #item3->{ 1 . 1 . 1 . 1 . 1} }. diag := (GETVerticalBarDiagram new) modelLabels: [:each | each key ]; y: [:each | each value size]; yAxisLabel: 'Count'; valueAxis; height:200; spacing:20; yAxisOnRight; color: Color veryLightGray; axisColor: Color veryLightGray; models: grouped; yourself. diag2 := (GETVerticalBarDiagram new) y: [:each | each value sum]; regularAxis; height: 200; spacing:20; yAxisLabel: 'Sum'; color: (Color red); axisColor: (Color red); models: grouped; yourself. (builder unionDiagram) add: diag; add: diag2. builder open
You'll see it's very similar. There's two things I couldn't replicate so far, one of them is the rotating labels, as Roassal can't rotate labels yet, and the second one was the GapFraction, as axis in GraphET need some work yet, so implementing that kind of thing would be hard. I think I'll dedicate to a proper axis in the next couple of weeks.
Cheers :)!
---------- Forwarded message ---------- From: Tudor Girba tudor@tudorgirba.com Date: Sat, Jan 4, 2014 at 10:39 PM Subject: Re: [Pharo-dev] Feature for request for GraphET? To: Pharo Development List pharo-dev@lists.pharo.org
Here is one thing I would want: a correspondent Graph-ET functionality to make something like this EyeSee script work as in the first attached picture.
renderer := ESDiagramRenderer new. grouped := { #item1->{10 . 12 . 11 . 14 } . #item2-> { 1 . 1 . 20 } . #item3->{ 1 . 1 . 1 . 1 . 1} }. diag := (ESVerticalBarDiagram new) identifier: [:each | each key ]; y: [:each | each value size]; yAxisLabel: 'Count'; valueAxis; rightYAxis; defaultColor: Color veryVeryLightGray; axisColor: Color veryVeryLightGray; models: grouped; rotatedLabels: true; yourself. diag2 := (ESVerticalBarDiagram new) y: [:each | each value sum]; regularAxis; yAxisLabel: 'Sum'; gapFraction: 2 / 3; defaultColor: (Color red); axisColor: (Color red); models: grouped; yourself. (renderer compositeDiagram) add: diag; add: diag2. renderer open
<Screenshot 2014-01-04 22.31.57.png>
The best I could produce with Graph-ET is this (I commented out the message to which I did not find a correspondent):
builder := GETDiagramBuilder new. grouped := { #item1->{10 . 12 . 11 . 14 } . #item2-> { 1 . 1 . 20 } . #item3->{ 1 . 1 . 1 . 1 . 1} }. diag := (GETVerticalBarDiagram new) "identifier: [:each | each key ];" y: [:each | each value size]; yAxisLabel: 'Count'; valueAxisLine; "rightYAxis;" color: Color veryLightGray; "axisColor: Color veryLightGray;" models: grouped; "rotatedLabels: true;" yourself. diag2 := (GETVerticalBarDiagram new) y: [:each | each value sum]; regularAxis; yAxisLabel: 'Sum'; "gapFraction: 2 / 3;" color: (Color red); "axisColor: (Color red);" models: grouped; yourself. (builder compositeDiagram) add: diag; add: diag2. builder open
<Screenshot 2014-01-04 22.36.40.png>
Cheers, Doru

Hi Ben!
This will come with Roassal2. It is well advanced already...
Alexandre
On Jan 9, 2014, at 12:26 PM, btc@openInWorld.com wrote:
Daniel Aviv Notario wrote:
There's two things I couldn't replicate so far, one of them is the rotating labels, as Roassal can't rotate labels yet,
A while ago there was a request for Roassal features. I probably didn't think of this then, but rotated text would be a great addition - particularly for drawing domain like schematic diagram editors.
cheers -ben _______________________________________________ Moose-dev mailing list Moose-dev@iam.unibe.ch https://www.iam.unibe.ch/mailman/listinfo/moose-dev

-----Message d'origine----- De : moose-dev-bounces@iam.unibe.ch [mailto:moose-dev-bounces@iam.unibe.ch] De la part de Kevin Lanvin Envoyé : lundi 6 janvier 2014 15:30 À : Moose-related development Objet : [Moose-dev] Re: [Pharo-dev] Feature for request for GraphET?
Hello, I'm displaying a graph on the web , and it's working well, but then I want tu put a second diagram on my page. But diagrams are displayed in <div id="chart"></div> So i can't use a second division to display another one. Could it be possible to use class instead of id ?
Hi Kevin,
I think you can't use the class tag instead of id. The id tag has to be unique in the web page. Class tag is not unique and it's used mostly for the css tags.
If you want to display two diagrams in the page, put the tag : <div id="chart1"></div> as a placeholder for the first and <div id="chart2"></div> for the second. You have to set also the controller (GraphET) to display the right chart in the right tag, by default, it seems to be set with "chart".
I hope that it will help,
Vincent Blondeau
It seems that 'chart' isn't even written in Graph-ET Package. I didn't find anything interesting in extra files too. I don't understand where this id is used. I thought it was just for css , or just rendering axis and so on ...
Thank you for helping
----- Mail original -----
De: "Vincent BLONDEAU" vincent.blondeau@polytech-lille.net À: "Moose-related development" moose-dev@iam.unibe.ch Envoyé: Lundi 6 Janvier 2014 16:54:25 Objet: [Moose-dev] Re: [Pharo-dev] Feature for request for GraphET?
-----Message d'origine----- De : moose-dev-bounces@iam.unibe.ch [mailto:moose-dev-bounces@iam.unibe.ch] De la part de Kevin Lanvin Envoyé : lundi 6 janvier 2014 15:30 À : Moose-related development Objet : [Moose-dev] Re: [Pharo-dev] Feature for request for GraphET?
Hello, I'm displaying a graph on the web , and it's working well, but then I want tu put a second diagram on my page. But diagrams are displayed in <div id="chart"></div> So i can't use a second division to display another one. Could it be possible to use class instead of id ?
Hi Kevin,
I think you can't use the class tag instead of id. The id tag has to be unique in the web page. Class tag is not unique and it's used mostly for the css tags.
If you want to display two diagrams in the page, put the tag : <div id="chart1"></div> as a placeholder for the first and <div id="chart2"></div> for the second. You have to set also the controller (GraphET) to display the right chart in the right tag, by default, it seems to be set with "chart".
I hope that it will help,
Vincent Blondeau
Moose-dev mailing list Moose-dev@iam.unibe.ch https://www.iam.unibe.ch/mailman/listinfo/moose-dev
-----Message d'origine----- De : moose-dev-bounces@iam.unibe.ch [mailto:moose-dev-bounces@iam.unibe.ch] De la part de Kevin Lanvin Envoyé : lundi 6 janvier 2014 17:11 À : Moose-related development Objet : [Moose-dev] Re: [Pharo-dev] Feature for request for GraphET?
It seems that 'chart' isn't even written in Graph-ET Package. I didn't find anything interesting in extra files too. I don't understand where this id is used. I thought it was just for css , or just rendering axis and so on ...
Ok, I think that the id tag used is "roassal-canvas". Look at the method named paper in RORaphaelCanvas (package ARoassal-Raphaeljs). Maybe you have to modify and extend it to add another graph.
Check if you use this tag for your first chart.
Thank you for helping
----- Mail original -----
De: "Vincent BLONDEAU" vincent.blondeau@polytech-lille.net À: "Moose-related development" moose-dev@iam.unibe.ch Envoyé: Lundi 6 Janvier 2014 16:54:25 Objet: [Moose-dev] Re: [Pharo-dev] Feature for request for GraphET?
-----Message d'origine----- De : moose-dev-bounces@iam.unibe.ch [mailto:moose-dev-bounces@iam.unibe.ch] De la part de Kevin Lanvin Envoyé : lundi 6 janvier 2014 15:30 À : Moose-related development Objet : [Moose-dev] Re: [Pharo-dev] Feature for request for GraphET?
Hello, I'm displaying a graph on the web , and it's working well, but then I want tu put a second diagram on my page. But diagrams are displayed in <div id="chart"></div> So i can't use a second division to display another one. Could it be possible to use class instead of id ?
Hi Kevin,
I think you can't use the class tag instead of id. The id tag has to be unique in the web page. Class tag is not unique and it's used mostly for the css tags.
If you want to display two diagrams in the page, put the tag : <div id="chart1"></div> as a placeholder for the first and <div id="chart2"></div> for the second. You have to set also the controller (GraphET) to display the right chart in the right tag, by default, it seems to be set with "chart".
I hope that it will help,
Vincent Blondeau
Moose-dev mailing list Moose-dev@iam.unibe.ch https://www.iam.unibe.ch/mailman/listinfo/moose-dev
_______________________________________________ Moose-dev mailing list Moose-dev@iam.unibe.ch https://www.iam.unibe.ch/mailman/listinfo/moose-dev
This package isn't even loaded on my image so I don't think that the problem is coming from here.
----- Mail original -----
De: "Vincent BLONDEAU" vincent.blondeau@polytech-lille.net À: "Moose-related development" moose-dev@iam.unibe.ch Envoyé: Lundi 6 Janvier 2014 17:22:22 Objet: [Moose-dev] Re: [Pharo-dev] Feature for request for GraphET?
-----Message d'origine----- De : moose-dev-bounces@iam.unibe.ch [mailto:moose-dev-bounces@iam.unibe.ch] De la part de Kevin Lanvin Envoyé : lundi 6 janvier 2014 17:11 À : Moose-related development Objet : [Moose-dev] Re: [Pharo-dev] Feature for request for GraphET?
It seems that 'chart' isn't even written in Graph-ET Package. I didn't find anything interesting in extra files too. I don't understand where this id is used. I thought it was just for css , or just rendering axis and so on ...
Ok, I think that the id tag used is "roassal-canvas". Look at the method named paper in RORaphaelCanvas (package ARoassal-Raphaeljs). Maybe you have to modify and extend it to add another graph.
Check if you use this tag for your first chart.
Thank you for helping
----- Mail original -----
De: "Vincent BLONDEAU" vincent.blondeau@polytech-lille.net À: "Moose-related development" moose-dev@iam.unibe.ch Envoyé: Lundi 6 Janvier 2014 16:54:25 Objet: [Moose-dev] Re: [Pharo-dev] Feature for request for GraphET?
-----Message d'origine----- De : moose-dev-bounces@iam.unibe.ch [mailto:moose-dev-bounces@iam.unibe.ch] De la part de Kevin Lanvin Envoyé : lundi 6 janvier 2014 15:30 À : Moose-related development Objet : [Moose-dev] Re: [Pharo-dev] Feature for request for GraphET?
Hello, I'm displaying a graph on the web , and it's working well, but then I want tu put a second diagram on my page. But diagrams are displayed in <div id="chart"></div> So i can't use a second division to display another one. Could it be possible to use class instead of id ?
Hi Kevin,
I think you can't use the class tag instead of id. The id tag has to be unique in the web page. Class tag is not unique and it's used mostly for the css tags.
If you want to display two diagrams in the page, put the tag : <div id="chart1"></div> as a placeholder for the first and <div id="chart2"></div> for the second. You have to set also the controller (GraphET) to display the right chart in the right tag, by default, it seems to be set with "chart".
I hope that it will help,
Vincent Blondeau
Moose-dev mailing list Moose-dev@iam.unibe.ch https://www.iam.unibe.ch/mailman/listinfo/moose-dev
Moose-dev mailing list Moose-dev@iam.unibe.ch https://www.iam.unibe.ch/mailman/listinfo/moose-dev
Moose-dev mailing list Moose-dev@iam.unibe.ch https://www.iam.unibe.ch/mailman/listinfo/moose-dev
I have a question that could help me to understand: Why is the 'chart' division empty ? How is this division used ?
I've found a piece of code containing 'chart' in ROHTMLExporter >> addSVGInitialization but it's into javascript code so I don't know if it's the right place to fix it.
----- Mail original -----
De: "Kevin Lanvin" kevin.lanvin@inria.fr À: "Moose-related development" moose-dev@iam.unibe.ch Envoyé: Lundi 6 Janvier 2014 17:10:33 Objet: [Moose-dev] Re: [Pharo-dev] Feature for request for GraphET?
It seems that 'chart' isn't even written in Graph-ET Package. I didn't find anything interesting in extra files too. I don't understand where this id is used. I thought it was just for css , or just rendering axis and so on ...
Thank you for helping
----- Mail original -----
De: "Vincent BLONDEAU" vincent.blondeau@polytech-lille.net À: "Moose-related development" moose-dev@iam.unibe.ch Envoyé: Lundi 6 Janvier 2014 16:54:25 Objet: [Moose-dev] Re: [Pharo-dev] Feature for request for GraphET?
-----Message d'origine----- De : moose-dev-bounces@iam.unibe.ch [mailto:moose-dev-bounces@iam.unibe.ch] De la part de Kevin Lanvin Envoyé : lundi 6 janvier 2014 15:30 À : Moose-related development Objet : [Moose-dev] Re: [Pharo-dev] Feature for request for GraphET?
Hello, I'm displaying a graph on the web , and it's working well, but then I want tu put a second diagram on my page. But diagrams are displayed in <div id="chart"></div> So i can't use a second division to display another one. Could it be possible to use class instead of id ?
Hi Kevin,
I think you can't use the class tag instead of id. The id tag has to be unique in the web page. Class tag is not unique and it's used mostly for the css tags.
If you want to display two diagrams in the page, put the tag : <div id="chart1"></div> as a placeholder for the first and <div id="chart2"></div> for the second. You have to set also the controller (GraphET) to display the right chart in the right tag, by default, it seems to be set with "chart".
I hope that it will help,
Vincent Blondeau
Moose-dev mailing list Moose-dev@iam.unibe.ch https://www.iam.unibe.ch/mailman/listinfo/moose-dev
Moose-dev mailing list Moose-dev@iam.unibe.ch https://www.iam.unibe.ch/mailman/listinfo/moose-dev
-----Message d'origine----- De : moose-dev-bounces@iam.unibe.ch [mailto:moose-dev-bounces@iam.unibe.ch] De la part de Kevin Lanvin Envoyé : lundi 6 janvier 2014 17:25 À : Moose-related development Objet : [Moose-dev] Cannot display 2 diagrams in the same webpage
I have a question that could help me to understand: Why is the 'chart' division empty ?
The div 'chart' is just a placeholder to your graph.
How is this division used ?
As the id is unique, GraphET (with some JQuery functions) can retreive your div.
I've found a piece of code containing 'chart' in ROHTMLExporter >> addSVGInitialization but it's into javascript code so I don't know if it's the right place to fix it.
It's the only reference to 'chart' in the image. Set a breakpoint and try or modify it by 'chart1' for example.
----- Mail original -----
De: "Kevin Lanvin" kevin.lanvin@inria.fr À: "Moose-related development" moose-dev@iam.unibe.ch Envoyé: Lundi 6 Janvier 2014 17:10:33 Objet: [Moose-dev] Re: [Pharo-dev] Feature for request for GraphET?
It seems that 'chart' isn't even written in Graph-ET Package. I didn't find anything interesting in extra files too. I don't understand where this id is used. I thought it was just for css , or just rendering axis and so on ...
Thank you for helping
----- Mail original -----
De: "Vincent BLONDEAU" vincent.blondeau@polytech-lille.net À: "Moose-related development" moose-dev@iam.unibe.ch Envoyé: Lundi 6 Janvier 2014 16:54:25 Objet: [Moose-dev] Re: [Pharo-dev] Feature for request for GraphET?
-----Message d'origine----- De : moose-dev-bounces@iam.unibe.ch [mailto:moose-dev-bounces@iam.unibe.ch] De la part de Kevin Lanvin Envoyé : lundi 6 janvier 2014 15:30 À : Moose-related development Objet : [Moose-dev] Re: [Pharo-dev] Feature for request for GraphET?
Hello, I'm displaying a graph on the web , and it's working well, but then I want tu put a second diagram on my page. But diagrams are displayed in <div id="chart"></div> So i can't use a second division to display another one. Could it be possible to use class instead of id ?
Hi Kevin,
I think you can't use the class tag instead of id. The id tag has to be unique in the web page. Class tag is not unique and it's used mostly for the css tags.
If you want to display two diagrams in the page, put the tag : <div id="chart1"></div> as a placeholder for the first and <div id="chart2"></div> for the second. You have to set also the controller (GraphET) to display the right chart in the right tag, by default, it seems to be set with "chart".
I hope that it will help,
Vincent Blondeau
Moose-dev mailing list Moose-dev@iam.unibe.ch https://www.iam.unibe.ch/mailman/listinfo/moose-dev
Moose-dev mailing list Moose-dev@iam.unibe.ch https://www.iam.unibe.ch/mailman/listinfo/moose-dev
_______________________________________________ Moose-dev mailing list Moose-dev@iam.unibe.ch https://www.iam.unibe.ch/mailman/listinfo/moose-dev
Hello
In ROHTMLExporter>>addSVGInitialization , i've changed chart by chart1 and it's working , so the id is used at this place, you are right. Do you think it is possible to dynamically choose the id that you want to work with ?
Thank you
----- Mail original -----
De: "Vincent BLONDEAU" vincent.blondeau@polytech-lille.net À: "Moose-related development" moose-dev@iam.unibe.ch Envoyé: Lundi 6 Janvier 2014 17:42:06 Objet: [Moose-dev] Re: Cannot display 2 diagrams in the same webpage
-----Message d'origine----- De : moose-dev-bounces@iam.unibe.ch [mailto:moose-dev-bounces@iam.unibe.ch] De la part de Kevin Lanvin Envoyé : lundi 6 janvier 2014 17:25 À : Moose-related development Objet : [Moose-dev] Cannot display 2 diagrams in the same webpage
I have a question that could help me to understand: Why is the 'chart' division empty ?
The div 'chart' is just a placeholder to your graph.
How is this division used ?
As the id is unique, GraphET (with some JQuery functions) can retreive your div.
I've found a piece of code containing 'chart' in ROHTMLExporter >> addSVGInitialization but it's into javascript code so I don't know if it's the right place to fix it.
It's the only reference to 'chart' in the image. Set a breakpoint and try or modify it by 'chart1' for example.
----- Mail original -----
De: "Kevin Lanvin" kevin.lanvin@inria.fr À: "Moose-related development" moose-dev@iam.unibe.ch Envoyé: Lundi 6 Janvier 2014 17:10:33 Objet: [Moose-dev] Re: [Pharo-dev] Feature for request for GraphET?
It seems that 'chart' isn't even written in Graph-ET Package. I didn't find anything interesting in extra files too. I don't understand where this id is used. I thought it was just for css , or just rendering axis and so on ...
Thank you for helping
----- Mail original -----
De: "Vincent BLONDEAU" vincent.blondeau@polytech-lille.net À: "Moose-related development" moose-dev@iam.unibe.ch Envoyé: Lundi 6 Janvier 2014 16:54:25 Objet: [Moose-dev] Re: [Pharo-dev] Feature for request for GraphET?
-----Message d'origine----- De : moose-dev-bounces@iam.unibe.ch [mailto:moose-dev-bounces@iam.unibe.ch] De la part de Kevin Lanvin Envoyé : lundi 6 janvier 2014 15:30 À : Moose-related development Objet : [Moose-dev] Re: [Pharo-dev] Feature for request for GraphET?
Hello, I'm displaying a graph on the web , and it's working well, but then I want tu put a second diagram on my page. But diagrams are displayed in <div id="chart"></div> So i can't use a second division to display another one. Could it be possible to use class instead of id ?
Hi Kevin,
I think you can't use the class tag instead of id. The id tag has to be unique in the web page. Class tag is not unique and it's used mostly for the css tags.
If you want to display two diagrams in the page, put the tag :
<div id="chart1"></div> as a placeholder for the first and <div id="chart2"></div> for the second. You have to set also the controller (GraphET) to display the right chart in the right tag, by default, it seems to be set with "chart".
I hope that it will help,
Vincent Blondeau
Moose-dev mailing list Moose-dev@iam.unibe.ch https://www.iam.unibe.ch/mailman/listinfo/moose-dev
Moose-dev mailing list Moose-dev@iam.unibe.ch https://www.iam.unibe.ch/mailman/listinfo/moose-dev
Moose-dev mailing list Moose-dev@iam.unibe.ch https://www.iam.unibe.ch/mailman/listinfo/moose-dev
Moose-dev mailing list Moose-dev@iam.unibe.ch https://www.iam.unibe.ch/mailman/listinfo/moose-dev
Le 07/01/2014 10:33, Kevin Lanvin a écrit :
Hello
In ROHTMLExporter>>addSVGInitialization , i've changed chart by chart1 and it's working , so the id is used at this place, you are right. Do you think it is possible to dynamically choose the id that you want to work with ?
Of course ! That Smalltalk ! You can redefine the method in a new subclass with an other variable instance (idTag for example) which will be set and used by the new method.
I let you see how to bind this class to your code. You probably have to change couple classes.
Thank you
----- Mail original -----
De: "Vincent BLONDEAU" vincent.blondeau@polytech-lille.net À: "Moose-related development" moose-dev@iam.unibe.ch Envoyé: Lundi 6 Janvier 2014 17:42:06 Objet: [Moose-dev] Re: Cannot display 2 diagrams in the same webpage
-----Message d'origine----- De : moose-dev-bounces@iam.unibe.ch [mailto:moose-dev-bounces@iam.unibe.ch] De la part de Kevin Lanvin Envoyé : lundi 6 janvier 2014 17:25 À : Moose-related development Objet : [Moose-dev] Cannot display 2 diagrams in the same webpage
I have a question that could help me to understand: Why is the 'chart' division empty ?
The div 'chart' is just a placeholder to your graph.
How is this division used ?
As the id is unique, GraphET (with some JQuery functions) can retreive your div.
I've found a piece of code containing 'chart' in ROHTMLExporter >> addSVGInitialization but it's into javascript code so I don't know if it's the right place to fix it.
It's the only reference to 'chart' in the image. Set a breakpoint and try or modify it by 'chart1' for example.
----- Mail original -----
De: "Kevin Lanvin" kevin.lanvin@inria.fr À: "Moose-related development" moose-dev@iam.unibe.ch Envoyé: Lundi 6 Janvier 2014 17:10:33 Objet: [Moose-dev] Re: [Pharo-dev] Feature for request for GraphET?
It seems that 'chart' isn't even written in Graph-ET Package. I didn't find anything interesting in extra files too. I don't understand where this id is used. I thought it was just for css , or just rendering axis and so on ...
Thank you for helping
----- Mail original -----
De: "Vincent BLONDEAU" vincent.blondeau@polytech-lille.net À: "Moose-related development" moose-dev@iam.unibe.ch Envoyé: Lundi 6 Janvier 2014 16:54:25 Objet: [Moose-dev] Re: [Pharo-dev] Feature for request for GraphET?
-----Message d'origine----- De : moose-dev-bounces@iam.unibe.ch [mailto:moose-dev-bounces@iam.unibe.ch] De la part de Kevin Lanvin Envoyé : lundi 6 janvier 2014 15:30 À : Moose-related development Objet : [Moose-dev] Re: [Pharo-dev] Feature for request for GraphET?
Hello, I'm displaying a graph on the web , and it's working well, but then I want tu put a second diagram on my page. But diagrams are displayed in <div id="chart"></div> So i can't use a second division to display another one. Could it be possible to use class instead of id ?
Hi Kevin,
I think you can't use the class tag instead of id. The id tag has to be unique in the web page. Class tag is not unique and it's used mostly for the css tags.
If you want to display two diagrams in the page, put the tag :
<div id="chart1"></div> as a placeholder for the first and <div id="chart2"></div> for the second. You have to set also the controller (GraphET) to display the right chart in the right tag, by default, it seems to be set with "chart".
I hope that it will help,
Vincent Blondeau
Moose-dev mailing list Moose-dev@iam.unibe.ch https://www.iam.unibe.ch/mailman/listinfo/moose-dev
Moose-dev mailing list Moose-dev@iam.unibe.ch https://www.iam.unibe.ch/mailman/listinfo/moose-dev
Moose-dev mailing list Moose-dev@iam.unibe.ch https://www.iam.unibe.ch/mailman/listinfo/moose-dev
Moose-dev mailing list Moose-dev@iam.unibe.ch https://www.iam.unibe.ch/mailman/listinfo/moose-dev
Moose-dev mailing list Moose-dev@iam.unibe.ch https://www.iam.unibe.ch/mailman/listinfo/moose-dev
Thanks to work on this. We really appreciate
Cheers, Alexandre
Le 07-01-2014 à 7:22, Vincent Blondeau vincent.blondeau@polytech-lille.net a écrit :
Le 07/01/2014 10:33, Kevin Lanvin a écrit :
Hello
In ROHTMLExporter>>addSVGInitialization , i've changed chart by chart1 and it's working , so the id is used at this place, you are right. Do you think it is possible to dynamically choose the id that you want to work with ?
Of course ! That Smalltalk ! You can redefine the method in a new subclass with an other variable instance (idTag for example) which will be set and used by the new method.
I let you see how to bind this class to your code. You probably have to change couple classes.
Thank you
----- Mail original -----
De: "Vincent BLONDEAU" vincent.blondeau@polytech-lille.net À: "Moose-related development" moose-dev@iam.unibe.ch Envoyé: Lundi 6 Janvier 2014 17:42:06 Objet: [Moose-dev] Re: Cannot display 2 diagrams in the same webpage
-----Message d'origine----- De : moose-dev-bounces@iam.unibe.ch [mailto:moose-dev-bounces@iam.unibe.ch] De la part de Kevin Lanvin Envoyé : lundi 6 janvier 2014 17:25 À : Moose-related development Objet : [Moose-dev] Cannot display 2 diagrams in the same webpage
I have a question that could help me to understand: Why is the 'chart' division empty ?
The div 'chart' is just a placeholder to your graph.
How is this division used ?
As the id is unique, GraphET (with some JQuery functions) can retreive your div.
I've found a piece of code containing 'chart' in ROHTMLExporter >> addSVGInitialization but it's into javascript code so I don't know if it's the right place to fix it.
It's the only reference to 'chart' in the image. Set a breakpoint and try or modify it by 'chart1' for example.
----- Mail original -----
De: "Kevin Lanvin" kevin.lanvin@inria.fr À: "Moose-related development" moose-dev@iam.unibe.ch Envoyé: Lundi 6 Janvier 2014 17:10:33 Objet: [Moose-dev] Re: [Pharo-dev] Feature for request for GraphET?
It seems that 'chart' isn't even written in Graph-ET Package. I didn't find anything interesting in extra files too. I don't understand where this id is used. I thought it was just for css , or just rendering axis and so on ...
Thank you for helping
----- Mail original -----
De: "Vincent BLONDEAU" vincent.blondeau@polytech-lille.net À: "Moose-related development" moose-dev@iam.unibe.ch Envoyé: Lundi 6 Janvier 2014 16:54:25 Objet: [Moose-dev] Re: [Pharo-dev] Feature for request for GraphET?
-----Message d'origine----- De : moose-dev-bounces@iam.unibe.ch [mailto:moose-dev-bounces@iam.unibe.ch] De la part de Kevin Lanvin Envoyé : lundi 6 janvier 2014 15:30 À : Moose-related development Objet : [Moose-dev] Re: [Pharo-dev] Feature for request for GraphET?
Hello, I'm displaying a graph on the web , and it's working well, but then I want tu put a second diagram on my page. But diagrams are displayed in <div id="chart"></div> So i can't use a second division to display another one. Could it be possible to use class instead of id ?
Hi Kevin,
I think you can't use the class tag instead of id. The id tag has to be unique in the web page. Class tag is not unique and it's used mostly for the css tags.
If you want to display two diagrams in the page, put the tag :
<div id="chart1"></div> as a placeholder for the first and <div id="chart2"></div> for the second. You have to set also the controller (GraphET) to display the right chart in the right tag, by default, it seems to be set with "chart".
I hope that it will help,
Vincent Blondeau
Moose-dev mailing list Moose-dev@iam.unibe.ch https://www.iam.unibe.ch/mailman/listinfo/moose-dev
Moose-dev mailing list Moose-dev@iam.unibe.ch https://www.iam.unibe.ch/mailman/listinfo/moose-dev
Moose-dev mailing list Moose-dev@iam.unibe.ch https://www.iam.unibe.ch/mailman/listinfo/moose-dev
Moose-dev mailing list Moose-dev@iam.unibe.ch https://www.iam.unibe.ch/mailman/listinfo/moose-dev
Moose-dev mailing list Moose-dev@iam.unibe.ch https://www.iam.unibe.ch/mailman/listinfo/moose-dev
Moose-dev mailing list Moose-dev@iam.unibe.ch https://www.iam.unibe.ch/mailman/listinfo/moose-dev
Hi, Now I can display 2 diagrams (I've changed the addSVGInitialization: method , I'll send it to alexandre). My new problem is: if I display 1 diagram, everything is ok, but if I display 2, the second one isn't displayed correctly. All the elements included in <path> tag are at the wrong place. I tried to display only the second one , and it's working perfectly so it's not coming from the diagram itself. I tried to invert the diagrams , and its exactly the same problem : the first one displayed is ok , not the second.
Thank you
----- Mail original -----
De: "Kevin Lanvin" kevin.lanvin@inria.fr À: "Moose-related development" moose-dev@iam.unibe.ch Envoyé: Mardi 7 Janvier 2014 10:33:37 Objet: [Moose-dev] Re: Cannot display 2 diagrams in the same webpage
Hello
In ROHTMLExporter>>addSVGInitialization , i've changed chart by chart1 and it's working , so the id is used at this place, you are right. Do you think it is possible to dynamically choose the id that you want to work with ?
Thank you
----- Mail original -----
De: "Vincent BLONDEAU" vincent.blondeau@polytech-lille.net À: "Moose-related development" moose-dev@iam.unibe.ch Envoyé: Lundi 6 Janvier 2014 17:42:06 Objet: [Moose-dev] Re: Cannot display 2 diagrams in the same webpage
-----Message d'origine----- De : moose-dev-bounces@iam.unibe.ch [mailto:moose-dev-bounces@iam.unibe.ch] De la part de Kevin Lanvin Envoyé : lundi 6 janvier 2014 17:25 À : Moose-related development Objet : [Moose-dev] Cannot display 2 diagrams in the same webpage
I have a question that could help me to understand: Why is the 'chart' division empty ?
The div 'chart' is just a placeholder to your graph.
How is this division used ?
As the id is unique, GraphET (with some JQuery functions) can retreive your div.
I've found a piece of code containing 'chart' in ROHTMLExporter >> addSVGInitialization but it's into javascript code so I don't know if it's the right place to fix it.
It's the only reference to 'chart' in the image. Set a breakpoint and try or modify it by 'chart1' for example.
----- Mail original -----
De: "Kevin Lanvin" kevin.lanvin@inria.fr À: "Moose-related development" moose-dev@iam.unibe.ch Envoyé: Lundi 6 Janvier 2014 17:10:33 Objet: [Moose-dev] Re: [Pharo-dev] Feature for request for GraphET?
It seems that 'chart' isn't even written in Graph-ET Package. I didn't find anything interesting in extra files too. I don't understand where this id is used. I thought it was just for css , or just rendering axis and so on ...
Thank you for helping
----- Mail original -----
De: "Vincent BLONDEAU" vincent.blondeau@polytech-lille.net À: "Moose-related development" moose-dev@iam.unibe.ch Envoyé: Lundi 6 Janvier 2014 16:54:25 Objet: [Moose-dev] Re: [Pharo-dev] Feature for request for GraphET?
-----Message d'origine----- De : moose-dev-bounces@iam.unibe.ch [mailto:moose-dev-bounces@iam.unibe.ch] De la part de Kevin Lanvin Envoyé : lundi 6 janvier 2014 15:30 À : Moose-related development Objet : [Moose-dev] Re: [Pharo-dev] Feature for request for GraphET?
Hello, I'm displaying a graph on the web , and it's working well, but then I want tu put a second diagram on my page. But diagrams are displayed in <div id="chart"></div> So i can't use a second division to display another one. Could it be possible to use class instead of id ?
Hi Kevin,
I think you can't use the class tag instead of id. The id tag has to be unique in the web page. Class tag is not unique and it's used mostly for the css tags.
If you want to display two diagrams in the page, put the tag :
<div id="chart1"></div> as a placeholder for the first and <div id="chart2"></div> for the second. You have to set also the controller (GraphET) to display the right chart in the right tag, by default, it seems to be set with "chart".
I hope that it will help,
Vincent Blondeau
Moose-dev mailing list Moose-dev@iam.unibe.ch https://www.iam.unibe.ch/mailman/listinfo/moose-dev
Moose-dev mailing list Moose-dev@iam.unibe.ch https://www.iam.unibe.ch/mailman/listinfo/moose-dev
Moose-dev mailing list Moose-dev@iam.unibe.ch https://www.iam.unibe.ch/mailman/listinfo/moose-dev
Moose-dev mailing list Moose-dev@iam.unibe.ch https://www.iam.unibe.ch/mailman/listinfo/moose-dev
Moose-dev mailing list Moose-dev@iam.unibe.ch https://www.iam.unibe.ch/mailman/listinfo/moose-dev
Vincent told me to look after another unique id selection during the svg initialization process but I didn't find any.
----- Mail original -----
De: "Kevin Lanvin" kevin.lanvin@inria.fr À: "Moose-related development" moose-dev@iam.unibe.ch Envoyé: Mardi 7 Janvier 2014 13:28:27 Objet: [Moose-dev] Re: Cannot display 2 diagrams in the same webpage
Hi, Now I can display 2 diagrams (I've changed the addSVGInitialization: method , I'll send it to alexandre). My new problem is: if I display 1 diagram, everything is ok, but if I display 2, the second one isn't displayed correctly. All the elements included in <path> tag are at the wrong place. I tried to display only the second one , and it's working perfectly so it's not coming from the diagram itself. I tried to invert the diagrams , and its exactly the same problem : the first one displayed is ok , not the second.
Thank you
----- Mail original -----
De: "Kevin Lanvin" kevin.lanvin@inria.fr À: "Moose-related development" moose-dev@iam.unibe.ch Envoyé: Mardi 7 Janvier 2014 10:33:37 Objet: [Moose-dev] Re: Cannot display 2 diagrams in the same webpage
Hello
In ROHTMLExporter>>addSVGInitialization , i've changed chart by chart1 and it's working , so the id is used at this place, you are right. Do you think it is possible to dynamically choose the id that you want to work with ?
Thank you
----- Mail original -----
De: "Vincent BLONDEAU" vincent.blondeau@polytech-lille.net À: "Moose-related development" moose-dev@iam.unibe.ch Envoyé: Lundi 6 Janvier 2014 17:42:06 Objet: [Moose-dev] Re: Cannot display 2 diagrams in the same webpage
-----Message d'origine----- De : moose-dev-bounces@iam.unibe.ch [mailto:moose-dev-bounces@iam.unibe.ch] De la part de Kevin Lanvin Envoyé : lundi 6 janvier 2014 17:25 À : Moose-related development Objet : [Moose-dev] Cannot display 2 diagrams in the same webpage
I have a question that could help me to understand: Why is the 'chart' division empty ?
The div 'chart' is just a placeholder to your graph.
How is this division used ?
As the id is unique, GraphET (with some JQuery functions) can retreive your div.
I've found a piece of code containing 'chart' in ROHTMLExporter
addSVGInitialization but it's into javascript code so I don't know if it's the right place to fix it.
It's the only reference to 'chart' in the image. Set a breakpoint and try or modify it by 'chart1' for example.
----- Mail original -----
De: "Kevin Lanvin" kevin.lanvin@inria.fr À: "Moose-related development" moose-dev@iam.unibe.ch Envoyé: Lundi 6 Janvier 2014 17:10:33 Objet: [Moose-dev] Re: [Pharo-dev] Feature for request for GraphET?
It seems that 'chart' isn't even written in Graph-ET Package. I didn't find anything interesting in extra files too. I don't understand where this id is used. I thought it was just for css , or just rendering axis and so on ...
Thank you for helping
----- Mail original -----
De: "Vincent BLONDEAU" vincent.blondeau@polytech-lille.net À: "Moose-related development" moose-dev@iam.unibe.ch Envoyé: Lundi 6 Janvier 2014 16:54:25 Objet: [Moose-dev] Re: [Pharo-dev] Feature for request for GraphET?
-----Message d'origine----- De : moose-dev-bounces@iam.unibe.ch [mailto:moose-dev-bounces@iam.unibe.ch] De la part de Kevin Lanvin Envoyé : lundi 6 janvier 2014 15:30 À : Moose-related development Objet : [Moose-dev] Re: [Pharo-dev] Feature for request for GraphET?
Hello, I'm displaying a graph on the web , and it's working well, but then I want tu put a second diagram on my page. But diagrams are displayed in <div id="chart"></div> So i can't use a second division to display another one. Could it be possible to use class instead of id ?
Hi Kevin,
I think you can't use the class tag instead of id. The id tag has to be unique in the web page. Class tag is not unique and it's used mostly for the css tags.
If you want to display two diagrams in the page, put the tag :
<div id="chart1"></div> as a placeholder for the first and <div id="chart2"></div> for the second. You have to set also the controller (GraphET) to display the right chart in the right tag, by default, it seems to be set with "chart".
I hope that it will help,
Vincent Blondeau
Moose-dev mailing list Moose-dev@iam.unibe.ch https://www.iam.unibe.ch/mailman/listinfo/moose-dev
Moose-dev mailing list Moose-dev@iam.unibe.ch https://www.iam.unibe.ch/mailman/listinfo/moose-dev
Moose-dev mailing list Moose-dev@iam.unibe.ch https://www.iam.unibe.ch/mailman/listinfo/moose-dev
Moose-dev mailing list Moose-dev@iam.unibe.ch https://www.iam.unibe.ch/mailman/listinfo/moose-dev
Moose-dev mailing list Moose-dev@iam.unibe.ch https://www.iam.unibe.ch/mailman/listinfo/moose-dev
Moose-dev mailing list Moose-dev@iam.unibe.ch https://www.iam.unibe.ch/mailman/listinfo/moose-dev
It seems that the 'd' attribute in the method: ROHTMLExporter >> addRenderingEdges isn't correctly set. Do we have to change the js code to fix it ?
----- Mail original -----
De: "Kevin Lanvin" kevin.lanvin@inria.fr À: "Moose-related development" moose-dev@iam.unibe.ch Envoyé: Mardi 7 Janvier 2014 13:32:48 Objet: [Moose-dev] Re: Cannot display 2 diagrams in the same webpage
Vincent told me to look after another unique id selection during the svg initialization process but I didn't find any.
----- Mail original -----
De: "Kevin Lanvin" kevin.lanvin@inria.fr À: "Moose-related development" moose-dev@iam.unibe.ch Envoyé: Mardi 7 Janvier 2014 13:28:27 Objet: [Moose-dev] Re: Cannot display 2 diagrams in the same webpage
Hi, Now I can display 2 diagrams (I've changed the addSVGInitialization: method , I'll send it to alexandre). My new problem is: if I display 1 diagram, everything is ok, but if I display 2, the second one isn't displayed correctly. All the elements included in <path> tag are at the wrong place. I tried to display only the second one , and it's working perfectly so it's not coming from the diagram itself. I tried to invert the diagrams , and its exactly the same problem : the first one displayed is ok , not the second.
Thank you
----- Mail original -----
De: "Kevin Lanvin" kevin.lanvin@inria.fr À: "Moose-related development" moose-dev@iam.unibe.ch Envoyé: Mardi 7 Janvier 2014 10:33:37 Objet: [Moose-dev] Re: Cannot display 2 diagrams in the same webpage
Hello
In ROHTMLExporter>>addSVGInitialization , i've changed chart by chart1 and it's working , so the id is used at this place, you are right. Do you think it is possible to dynamically choose the id that you want to work with ?
Thank you
----- Mail original -----
De: "Vincent BLONDEAU" vincent.blondeau@polytech-lille.net À: "Moose-related development" moose-dev@iam.unibe.ch Envoyé: Lundi 6 Janvier 2014 17:42:06 Objet: [Moose-dev] Re: Cannot display 2 diagrams in the same webpage
-----Message d'origine----- De : moose-dev-bounces@iam.unibe.ch [mailto:moose-dev-bounces@iam.unibe.ch] De la part de Kevin Lanvin Envoyé : lundi 6 janvier 2014 17:25 À : Moose-related development Objet : [Moose-dev] Cannot display 2 diagrams in the same webpage
I have a question that could help me to understand: Why is the 'chart' division empty ?
The div 'chart' is just a placeholder to your graph.
How is this division used ?
As the id is unique, GraphET (with some JQuery functions) can retreive your div.
I've found a piece of code containing 'chart' in ROHTMLExporter
addSVGInitialization but it's into javascript code so I don't know if it's the right place to fix it.
It's the only reference to 'chart' in the image. Set a breakpoint and try or modify it by 'chart1' for example.
----- Mail original -----
De: "Kevin Lanvin" kevin.lanvin@inria.fr À: "Moose-related development" moose-dev@iam.unibe.ch Envoyé: Lundi 6 Janvier 2014 17:10:33 Objet: [Moose-dev] Re: [Pharo-dev] Feature for request for GraphET?
It seems that 'chart' isn't even written in Graph-ET Package. I didn't find anything interesting in extra files too. I don't understand where this id is used. I thought it was just for css , or just rendering axis and so on ...
Thank you for helping
----- Mail original -----
De: "Vincent BLONDEAU" vincent.blondeau@polytech-lille.net À: "Moose-related development" moose-dev@iam.unibe.ch Envoyé: Lundi 6 Janvier 2014 16:54:25 Objet: [Moose-dev] Re: [Pharo-dev] Feature for request for GraphET?
-----Message d'origine----- De : moose-dev-bounces@iam.unibe.ch [mailto:moose-dev-bounces@iam.unibe.ch] De la part de Kevin Lanvin Envoyé : lundi 6 janvier 2014 15:30 À : Moose-related development Objet : [Moose-dev] Re: [Pharo-dev] Feature for request for GraphET?
Hello, I'm displaying a graph on the web , and it's working well, but then I want tu put a second diagram on my page. But diagrams are displayed in <div id="chart"></div> So i can't use a second division to display another one. Could it be possible to use class instead of id ?
Hi Kevin,
I think you can't use the class tag instead of id. The id tag has to be unique in the web page. Class tag is not unique and it's used mostly for the css tags.
If you want to display two diagrams in the page, put the tag :
<div id="chart1"></div> as a placeholder for the first and <div id="chart2"></div> for the second. You have to set also the controller (GraphET) to display the right chart in the right tag, by default, it seems to be set with "chart".
I hope that it will help,
Vincent Blondeau
Moose-dev mailing list Moose-dev@iam.unibe.ch https://www.iam.unibe.ch/mailman/listinfo/moose-dev
Moose-dev mailing list Moose-dev@iam.unibe.ch https://www.iam.unibe.ch/mailman/listinfo/moose-dev
Moose-dev mailing list Moose-dev@iam.unibe.ch https://www.iam.unibe.ch/mailman/listinfo/moose-dev
Moose-dev mailing list Moose-dev@iam.unibe.ch https://www.iam.unibe.ch/mailman/listinfo/moose-dev
Moose-dev mailing list Moose-dev@iam.unibe.ch https://www.iam.unibe.ch/mailman/listinfo/moose-dev
Moose-dev mailing list Moose-dev@iam.unibe.ch https://www.iam.unibe.ch/mailman/listinfo/moose-dev
Moose-dev mailing list Moose-dev@iam.unibe.ch https://www.iam.unibe.ch/mailman/listinfo/moose-dev
It seems that the 'd' attribute in the method: ROHTMLExporter >> addRenderingEdges isn't correctly set. Do we have to change the js code to fix it ?
I am not sure to understand. The method is:
addRenderingEdges: fileStream
fileStream nextPutAll: '/***** RENDERING LINKS*****/ var links = dataset.links; var path = vis.selectAll("path") .data(links); path.enter().append("path") .attr("d", elbow) .attr("stroke", function(d) {return d.edgeColor});'; nextPutAll: ROPlatform current newLine.
What is wrong with it?
Alexandre
----- Mail original -----
De: "Kevin Lanvin" kevin.lanvin@inria.fr À: "Moose-related development" moose-dev@iam.unibe.ch Envoyé: Mardi 7 Janvier 2014 13:32:48 Objet: [Moose-dev] Re: Cannot display 2 diagrams in the same webpage
Vincent told me to look after another unique id selection during the svg initialization process but I didn't find any.
----- Mail original -----
De: "Kevin Lanvin" kevin.lanvin@inria.fr À: "Moose-related development" moose-dev@iam.unibe.ch Envoyé: Mardi 7 Janvier 2014 13:28:27 Objet: [Moose-dev] Re: Cannot display 2 diagrams in the same webpage
Hi, Now I can display 2 diagrams (I've changed the addSVGInitialization: method , I'll send it to alexandre). My new problem is: if I display 1 diagram, everything is ok, but if I display 2, the second one isn't displayed correctly. All the elements included in <path> tag are at the wrong place. I tried to display only the second one , and it's working perfectly so it's not coming from the diagram itself. I tried to invert the diagrams , and its exactly the same problem : the first one displayed is ok , not the second.
Thank you
----- Mail original -----
De: "Kevin Lanvin" kevin.lanvin@inria.fr À: "Moose-related development" moose-dev@iam.unibe.ch Envoyé: Mardi 7 Janvier 2014 10:33:37 Objet: [Moose-dev] Re: Cannot display 2 diagrams in the same webpage
Hello
In ROHTMLExporter>>addSVGInitialization , i've changed chart by chart1 and it's working , so the id is used at this place, you are right. Do you think it is possible to dynamically choose the id that you want to work with ?
Thank you
----- Mail original -----
De: "Vincent BLONDEAU" vincent.blondeau@polytech-lille.net À: "Moose-related development" moose-dev@iam.unibe.ch Envoyé: Lundi 6 Janvier 2014 17:42:06 Objet: [Moose-dev] Re: Cannot display 2 diagrams in the same webpage
-----Message d'origine----- De : moose-dev-bounces@iam.unibe.ch [mailto:moose-dev-bounces@iam.unibe.ch] De la part de Kevin Lanvin Envoyé : lundi 6 janvier 2014 17:25 À : Moose-related development Objet : [Moose-dev] Cannot display 2 diagrams in the same webpage
I have a question that could help me to understand: Why is the 'chart' division empty ?
The div 'chart' is just a placeholder to your graph.
How is this division used ?
As the id is unique, GraphET (with some JQuery functions) can retreive your div.
I've found a piece of code containing 'chart' in ROHTMLExporter
>
addSVGInitialization but it's into javascript code so I don't know if it's the right place to fix it.
It's the only reference to 'chart' in the image. Set a breakpoint and try or modify it by 'chart1' for example.
----- Mail original -----
De: "Kevin Lanvin" kevin.lanvin@inria.fr À: "Moose-related development" moose-dev@iam.unibe.ch Envoyé: Lundi 6 Janvier 2014 17:10:33 Objet: [Moose-dev] Re: [Pharo-dev] Feature for request for GraphET?
It seems that 'chart' isn't even written in Graph-ET Package. I didn't find anything interesting in extra files too. I don't understand where this id is used. I thought it was just for css , or just rendering axis and so on ...
Thank you for helping
----- Mail original ----- > De: "Vincent BLONDEAU" > vincent.blondeau@polytech-lille.net > À: "Moose-related development" moose-dev@iam.unibe.ch > Envoyé: Lundi 6 Janvier 2014 16:54:25 > Objet: [Moose-dev] Re: [Pharo-dev] Feature for request for > GraphET? > > > > -----Message d'origine----- > De : moose-dev-bounces@iam.unibe.ch > [mailto:moose-dev-bounces@iam.unibe.ch] > De la part de Kevin Lanvin > Envoyé : lundi 6 janvier 2014 15:30 > À : Moose-related development > Objet : [Moose-dev] Re: [Pharo-dev] Feature for request for > GraphET? > > Hello, > I'm displaying a graph on the web , and it's working well, > but > then > I want tu put a second diagram on my page. > But diagrams are displayed in <div id="chart"></div> So i > can't > use > a second division to display another one. > Could it be possible to use class instead of id ? > > > > Hi Kevin, > > I think you can't use the class tag instead of id. > The id tag has to be unique in the web page. > Class tag is not unique and it's used mostly for the css > tags. > > If you want to display two diagrams in the page, put the > tag > : > <div > id="chart1"></div> as a placeholder for the first and <div > id="chart2"></div> for the second. > You have to set also the controller (GraphET) to display > the > right > chart in the right tag, by default, it seems to be set with > "chart". > > I hope that it will help, > > Vincent Blondeau > > > > > _______________________________________________ > Moose-dev mailing list > Moose-dev@iam.unibe.ch > https://www.iam.unibe.ch/mailman/listinfo/moose-dev >
Moose-dev mailing list Moose-dev@iam.unibe.ch https://www.iam.unibe.ch/mailman/listinfo/moose-dev
Moose-dev mailing list Moose-dev@iam.unibe.ch https://www.iam.unibe.ch/mailman/listinfo/moose-dev
Moose-dev mailing list Moose-dev@iam.unibe.ch https://www.iam.unibe.ch/mailman/listinfo/moose-dev
Moose-dev mailing list Moose-dev@iam.unibe.ch https://www.iam.unibe.ch/mailman/listinfo/moose-dev
Moose-dev mailing list Moose-dev@iam.unibe.ch https://www.iam.unibe.ch/mailman/listinfo/moose-dev
Moose-dev mailing list Moose-dev@iam.unibe.ch https://www.iam.unibe.ch/mailman/listinfo/moose-dev
Moose-dev mailing list Moose-dev@iam.unibe.ch https://www.iam.unibe.ch/mailman/listinfo/moose-dev
When I display 2 diagrams, the values of d attributes in <path> tags are not the good ones. So all the lines are in the wrong place. I suppose that it's coming from the method addRenderingEdges because this is where the path tag is set up.
Kevin
----- Mail original -----
De: "Alexandre Bergel" alexandre.bergel@me.com À: "Moose-related development" moose-dev@iam.unibe.ch Envoyé: Mardi 7 Janvier 2014 19:13:43 Objet: [Moose-dev] Re: Cannot display 2 diagrams in the same webpage
It seems that the 'd' attribute in the method: ROHTMLExporter >> addRenderingEdges isn't correctly set. Do we have to change the js code to fix it ?
I am not sure to understand. The method is:
addRenderingEdges: fileStream
fileStream nextPutAll: '/***** RENDERING LINKS*****/ var links = dataset.links; var path = vis.selectAll("path") .data(links); path.enter().append("path") .attr("d", elbow) .attr("stroke", function(d) {return d.edgeColor});'; nextPutAll: ROPlatform current newLine.
What is wrong with it?
Alexandre
----- Mail original -----
De: "Kevin Lanvin" kevin.lanvin@inria.fr À: "Moose-related development" moose-dev@iam.unibe.ch Envoyé: Mardi 7 Janvier 2014 13:32:48 Objet: [Moose-dev] Re: Cannot display 2 diagrams in the same webpage
Vincent told me to look after another unique id selection during the svg initialization process but I didn't find any.
----- Mail original -----
De: "Kevin Lanvin" kevin.lanvin@inria.fr À: "Moose-related development" moose-dev@iam.unibe.ch Envoyé: Mardi 7 Janvier 2014 13:28:27 Objet: [Moose-dev] Re: Cannot display 2 diagrams in the same webpage
Hi, Now I can display 2 diagrams (I've changed the addSVGInitialization: method , I'll send it to alexandre). My new problem is: if I display 1 diagram, everything is ok, but if I display 2, the second one isn't displayed correctly. All the elements included in <path> tag are at the wrong place. I tried to display only the second one , and it's working perfectly so it's not coming from the diagram itself. I tried to invert the diagrams , and its exactly the same problem : the first one displayed is ok , not the second.
Thank you
----- Mail original -----
De: "Kevin Lanvin" kevin.lanvin@inria.fr À: "Moose-related development" moose-dev@iam.unibe.ch Envoyé: Mardi 7 Janvier 2014 10:33:37 Objet: [Moose-dev] Re: Cannot display 2 diagrams in the same webpage
Hello
In ROHTMLExporter>>addSVGInitialization , i've changed chart by chart1 and it's working , so the id is used at this place, you are right. Do you think it is possible to dynamically choose the id that you want to work with ?
Thank you
----- Mail original -----
De: "Vincent BLONDEAU" vincent.blondeau@polytech-lille.net À: "Moose-related development" moose-dev@iam.unibe.ch Envoyé: Lundi 6 Janvier 2014 17:42:06 Objet: [Moose-dev] Re: Cannot display 2 diagrams in the same webpage
-----Message d'origine----- De : moose-dev-bounces@iam.unibe.ch [mailto:moose-dev-bounces@iam.unibe.ch] De la part de Kevin Lanvin Envoyé : lundi 6 janvier 2014 17:25 À : Moose-related development Objet : [Moose-dev] Cannot display 2 diagrams in the same webpage
I have a question that could help me to understand: Why is the 'chart' division empty ?
The div 'chart' is just a placeholder to your graph.
How is this division used ?
As the id is unique, GraphET (with some JQuery functions) can retreive your div.
I've found a piece of code containing 'chart' in ROHTMLExporter >> addSVGInitialization but it's into javascript code so I don't know if it's the right place to fix it.
It's the only reference to 'chart' in the image. Set a breakpoint and try or modify it by 'chart1' for example.
----- Mail original ----- > De: "Kevin Lanvin" kevin.lanvin@inria.fr > À: "Moose-related development" moose-dev@iam.unibe.ch > Envoyé: Lundi 6 Janvier 2014 17:10:33 > Objet: [Moose-dev] Re: [Pharo-dev] Feature for request for > GraphET? > > It seems that 'chart' isn't even written in Graph-ET Package. > I didn't find anything interesting in extra files too. > I don't understand where this id is used. > I thought it was just for css , or just rendering axis and so > on > ... > > Thank you for helping > > ----- Mail original ----- >> De: "Vincent BLONDEAU" >> vincent.blondeau@polytech-lille.net >> À: "Moose-related development" moose-dev@iam.unibe.ch >> Envoyé: Lundi 6 Janvier 2014 16:54:25 >> Objet: [Moose-dev] Re: [Pharo-dev] Feature for request for >> GraphET? >> >> >> >> -----Message d'origine----- >> De : moose-dev-bounces@iam.unibe.ch >> [mailto:moose-dev-bounces@iam.unibe.ch] >> De la part de Kevin Lanvin >> Envoyé : lundi 6 janvier 2014 15:30 >> À : Moose-related development >> Objet : [Moose-dev] Re: [Pharo-dev] Feature for request for >> GraphET? >> >> Hello, >> I'm displaying a graph on the web , and it's working well, >> but >> then >> I want tu put a second diagram on my page. >> But diagrams are displayed in <div id="chart"></div> So i >> can't >> use >> a second division to display another one. >> Could it be possible to use class instead of id ? >> >> >> >> Hi Kevin, >> >> I think you can't use the class tag instead of id. >> The id tag has to be unique in the web page. >> Class tag is not unique and it's used mostly for the css >> tags. >> >> If you want to display two diagrams in the page, put the >> tag >> : >> <div >> id="chart1"></div> as a placeholder for the first and <div >> id="chart2"></div> for the second. >> You have to set also the controller (GraphET) to display >> the >> right >> chart in the right tag, by default, it seems to be set with >> "chart". >> >> I hope that it will help, >> >> Vincent Blondeau >> >> >> >> >> _______________________________________________ >> Moose-dev mailing list >> Moose-dev@iam.unibe.ch >> https://www.iam.unibe.ch/mailman/listinfo/moose-dev >> > > _______________________________________________ > Moose-dev mailing list > Moose-dev@iam.unibe.ch > https://www.iam.unibe.ch/mailman/listinfo/moose-dev >
Moose-dev mailing list Moose-dev@iam.unibe.ch https://www.iam.unibe.ch/mailman/listinfo/moose-dev
Moose-dev mailing list Moose-dev@iam.unibe.ch https://www.iam.unibe.ch/mailman/listinfo/moose-dev
Moose-dev mailing list Moose-dev@iam.unibe.ch https://www.iam.unibe.ch/mailman/listinfo/moose-dev
Moose-dev mailing list Moose-dev@iam.unibe.ch https://www.iam.unibe.ch/mailman/listinfo/moose-dev
Moose-dev mailing list Moose-dev@iam.unibe.ch https://www.iam.unibe.ch/mailman/listinfo/moose-dev
Moose-dev mailing list Moose-dev@iam.unibe.ch https://www.iam.unibe.ch/mailman/listinfo/moose-dev
-- _,.;:~^~:;._,.;:~^~:;._,.;:~^~:;._,.;:~^~:;._,.;: Alexandre Bergel http://www.bergel.eu ^~:;._,.;:~^~:;._,.;:~^~:;._,.;:~^~:;._,.;:~^~:;.
Moose-dev mailing list Moose-dev@iam.unibe.ch https://www.iam.unibe.ch/mailman/listinfo/moose-dev
Daniel's work is awesome, we needed this kind of diagrams too. And since I use this new way to build diagrams, there is no bug anymore if I build two on the same page.
So everything is fine now. Thank you all !
----- Mail original -----
De: "Kevin Lanvin" kevin.lanvin@inria.fr À: "Moose-related development" moose-dev@iam.unibe.ch Envoyé: Mercredi 8 Janvier 2014 10:04:24 Objet: [Moose-dev] Re: Cannot display 2 diagrams in the same webpage
When I display 2 diagrams, the values of d attributes in <path> tags are not the good ones. So all the lines are in the wrong place. I suppose that it's coming from the method addRenderingEdges because this is where the path tag is set up.
Kevin
----- Mail original -----
De: "Alexandre Bergel" alexandre.bergel@me.com À: "Moose-related development" moose-dev@iam.unibe.ch Envoyé: Mardi 7 Janvier 2014 19:13:43 Objet: [Moose-dev] Re: Cannot display 2 diagrams in the same webpage
It seems that the 'd' attribute in the method: ROHTMLExporter >> addRenderingEdges isn't correctly set. Do we have to change the js code to fix it ?
I am not sure to understand. The method is:
addRenderingEdges: fileStream
fileStream nextPutAll: '/***** RENDERING LINKS*****/ var links = dataset.links; var path = vis.selectAll("path") .data(links); path.enter().append("path") .attr("d", elbow) .attr("stroke", function(d) {return d.edgeColor});'; nextPutAll: ROPlatform current newLine.
What is wrong with it?
Alexandre
----- Mail original -----
De: "Kevin Lanvin" kevin.lanvin@inria.fr À: "Moose-related development" moose-dev@iam.unibe.ch Envoyé: Mardi 7 Janvier 2014 13:32:48 Objet: [Moose-dev] Re: Cannot display 2 diagrams in the same webpage
Vincent told me to look after another unique id selection during the svg initialization process but I didn't find any.
----- Mail original -----
De: "Kevin Lanvin" kevin.lanvin@inria.fr À: "Moose-related development" moose-dev@iam.unibe.ch Envoyé: Mardi 7 Janvier 2014 13:28:27 Objet: [Moose-dev] Re: Cannot display 2 diagrams in the same webpage
Hi, Now I can display 2 diagrams (I've changed the addSVGInitialization: method , I'll send it to alexandre). My new problem is: if I display 1 diagram, everything is ok, but if I display 2, the second one isn't displayed correctly. All the elements included in <path> tag are at the wrong place. I tried to display only the second one , and it's working perfectly so it's not coming from the diagram itself. I tried to invert the diagrams , and its exactly the same problem : the first one displayed is ok , not the second.
Thank you
----- Mail original -----
De: "Kevin Lanvin" kevin.lanvin@inria.fr À: "Moose-related development" moose-dev@iam.unibe.ch Envoyé: Mardi 7 Janvier 2014 10:33:37 Objet: [Moose-dev] Re: Cannot display 2 diagrams in the same webpage
Hello
In ROHTMLExporter>>addSVGInitialization , i've changed chart by chart1 and it's working , so the id is used at this place, you are right. Do you think it is possible to dynamically choose the id that you want to work with ?
Thank you
----- Mail original ----- > De: "Vincent BLONDEAU" vincent.blondeau@polytech-lille.net > À: "Moose-related development" moose-dev@iam.unibe.ch > Envoyé: Lundi 6 Janvier 2014 17:42:06 > Objet: [Moose-dev] Re: Cannot display 2 diagrams in the same > webpage > > > > -----Message d'origine----- > De : moose-dev-bounces@iam.unibe.ch > [mailto:moose-dev-bounces@iam.unibe.ch] > De la part de Kevin Lanvin > Envoyé : lundi 6 janvier 2014 17:25 > À : Moose-related development > Objet : [Moose-dev] Cannot display 2 diagrams in the same > webpage > > I have a question that could help me to understand: Why is > the > 'chart' > division empty ? > > The div 'chart' is just a placeholder to your graph. > > How is this division used ? > > As the id is unique, GraphET (with some JQuery functions) can > retreive your > div. > > I've found a piece of code containing 'chart' in > ROHTMLExporter >>> > addSVGInitialization but it's into javascript code so I don't > know > if > it's > the right place to fix it. > > It's the only reference to 'chart' in the image. Set a > breakpoint > and > try or > modify it by 'chart1' for example. > > ----- Mail original ----- >> De: "Kevin Lanvin" kevin.lanvin@inria.fr >> À: "Moose-related development" moose-dev@iam.unibe.ch >> Envoyé: Lundi 6 Janvier 2014 17:10:33 >> Objet: [Moose-dev] Re: [Pharo-dev] Feature for request for >> GraphET? >> >> It seems that 'chart' isn't even written in Graph-ET >> Package. >> I didn't find anything interesting in extra files too. >> I don't understand where this id is used. >> I thought it was just for css , or just rendering axis and >> so >> on >> ... >> >> Thank you for helping >> >> ----- Mail original ----- >>> De: "Vincent BLONDEAU" >>> vincent.blondeau@polytech-lille.net >>> À: "Moose-related development" moose-dev@iam.unibe.ch >>> Envoyé: Lundi 6 Janvier 2014 16:54:25 >>> Objet: [Moose-dev] Re: [Pharo-dev] Feature for request for >>> GraphET? >>> >>> >>> >>> -----Message d'origine----- >>> De : moose-dev-bounces@iam.unibe.ch >>> [mailto:moose-dev-bounces@iam.unibe.ch] >>> De la part de Kevin Lanvin >>> Envoyé : lundi 6 janvier 2014 15:30 >>> À : Moose-related development >>> Objet : [Moose-dev] Re: [Pharo-dev] Feature for request for >>> GraphET? >>> >>> Hello, >>> I'm displaying a graph on the web , and it's working well, >>> but >>> then >>> I want tu put a second diagram on my page. >>> But diagrams are displayed in <div id="chart"></div> So i >>> can't >>> use >>> a second division to display another one. >>> Could it be possible to use class instead of id ? >>> >>> >>> >>> Hi Kevin, >>> >>> I think you can't use the class tag instead of id. >>> The id tag has to be unique in the web page. >>> Class tag is not unique and it's used mostly for the css >>> tags. >>> >>> If you want to display two diagrams in the page, put the >>> tag >>> : >>> <div >>> id="chart1"></div> as a placeholder for the first and <div >>> id="chart2"></div> for the second. >>> You have to set also the controller (GraphET) to display >>> the >>> right >>> chart in the right tag, by default, it seems to be set with >>> "chart". >>> >>> I hope that it will help, >>> >>> Vincent Blondeau >>> >>> >>> >>> >>> _______________________________________________ >>> Moose-dev mailing list >>> Moose-dev@iam.unibe.ch >>> https://www.iam.unibe.ch/mailman/listinfo/moose-dev >>> >> >> _______________________________________________ >> Moose-dev mailing list >> Moose-dev@iam.unibe.ch >> https://www.iam.unibe.ch/mailman/listinfo/moose-dev >> > > _______________________________________________ > Moose-dev mailing list > Moose-dev@iam.unibe.ch > https://www.iam.unibe.ch/mailman/listinfo/moose-dev > > > > > _______________________________________________ > Moose-dev mailing list > Moose-dev@iam.unibe.ch > https://www.iam.unibe.ch/mailman/listinfo/moose-dev >
Moose-dev mailing list Moose-dev@iam.unibe.ch https://www.iam.unibe.ch/mailman/listinfo/moose-dev
Moose-dev mailing list Moose-dev@iam.unibe.ch https://www.iam.unibe.ch/mailman/listinfo/moose-dev
Moose-dev mailing list Moose-dev@iam.unibe.ch https://www.iam.unibe.ch/mailman/listinfo/moose-dev
Moose-dev mailing list Moose-dev@iam.unibe.ch https://www.iam.unibe.ch/mailman/listinfo/moose-dev
-- _,.;:~^~:;._,.;:~^~:;._,.;:~^~:;._,.;:~^~:;._,.;: Alexandre Bergel http://www.bergel.eu ^~:;._,.;:~^~:;._,.;:~^~:;._,.;:~^~:;._,.;:~^~:;.
Moose-dev mailing list Moose-dev@iam.unibe.ch https://www.iam.unibe.ch/mailman/listinfo/moose-dev
Moose-dev mailing list Moose-dev@iam.unibe.ch https://www.iam.unibe.ch/mailman/listinfo/moose-dev
-
 Alexandre Bergel
 -
 btc@openinworld.com
 -
 Daniel Aviv Notario
 -
 Kevin Lanvin
 -
 Tudor Girba
 -
 Vincent Blondeau
 -
Vincent BLONDEAU