
Hi!
Just to share a bit our progresses about Grapher.
***** Box plots *****
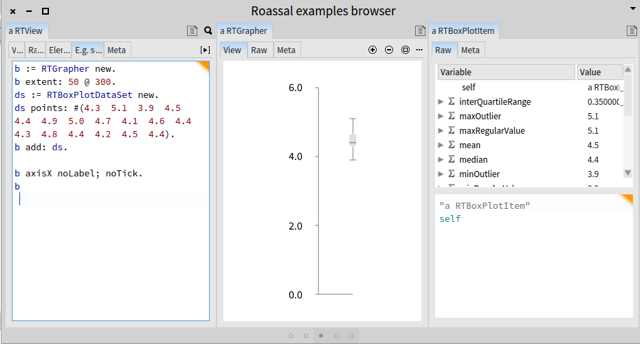
A box and whisker plot is a diagram showing statistical distribution of a data set. This is highly important as soon as you need to understand the distribution of some data.
Here is an example: b := RTGrapher new. b extent: 50 @ 300. ds := RTBoxPlotDataSet new. ds points: #(4.3 5.1 3.9 4.5 4.4 4.9 5.0 4.7 4.1 4.6 4.4 4.3 4.8 4.4 4.2 4.5 4.4). b add: ds.
b axisX noLabel; noTick. b
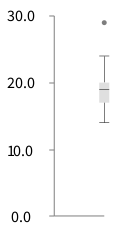
Another example with outliers:
b := RTGrapher new. b extent: 50 @ 300. ds := RTBoxPlotDataSet new. ds points: #(14 15 16 16 17 17 17 17 17 18 18 18 18 18 18 19 19 19 20 20 20 20 20 20 21 21 22 23 24 24 29). b add: ds.
b axisX noLabel; noTick. b
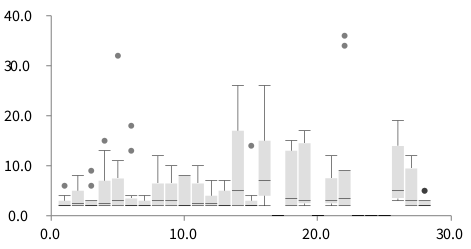
Slightly more elaborated example:
b := RTGrapher new. b extent: 400 @ 200. RTShape withAllSubclasses do: [ :cls | ds := RTBoxPlotDataSet new. ds points: (cls methods collect: #numberOfLinesOfCode). b add: ds. ].
b
***** Tick Improvement *****
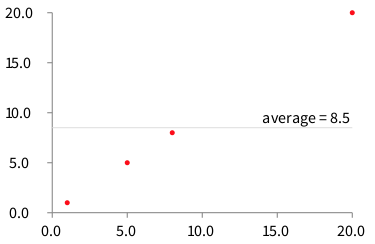
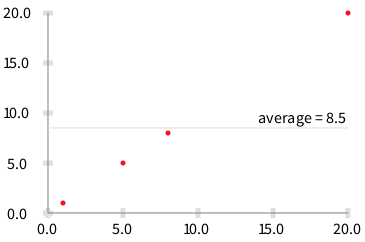
Ticks are now much nicer. Consider the following script:
b := RTGrapher new. ds := RTDataSet new. ds dotShape color: Color red. ds points: #(5 1 20 8). b add: ds. b addDecorator: (RTAverageDecorator new withLabel; labelConvertion: [ :value | ' average = ', (value round: 2) asString ]). b build. b
Before:
Now:
Not a big deal, but this is much nicer.
Cheers, Alexandre

Nice job!
Doru
On Thu, Apr 23, 2015 at 2:48 PM, Alexandre Bergel alexandre.bergel@me.com wrote:
Hi!
Just to share a bit our progresses about Grapher.
***** Box plots *****
A box and whisker plot is a diagram showing statistical distribution of a data set. This is highly important as soon as you need to understand the distribution of some data.
Here is an example: b := RTGrapher new. b extent: 50 @ 300. ds := RTBoxPlotDataSet new. ds points: #(4.3 5.1 3.9 4.5 4.4 4.9 5.0 4.7 4.1 4.6 4.4 4.3 4.8 4.4 4.2 4.5 4.4). b add: ds.
b axisX noLabel; noTick. b
Another example with outliers:
b := RTGrapher new. b extent: 50 @ 300. ds := RTBoxPlotDataSet new. ds points: #(14 15 16 16 17 17 17 17 17 18 18 18 18 18 18 19 19 19 20 20 20 20 20 20 21 21 22 23 24 24 29). b add: ds.
b axisX noLabel; noTick. b
Slightly more elaborated example:
b := RTGrapher new. b extent: 400 @ 200. RTShape withAllSubclasses do: [ :cls | ds := RTBoxPlotDataSet new. ds points: (cls methods collect: #numberOfLinesOfCode). b add: ds. ].
b
***** Tick Improvement *****
Ticks are now much nicer. Consider the following script:
b := RTGrapher new. ds := RTDataSet new. ds dotShape color: Color red. ds points: #(5 1 20 8). b add: ds. b addDecorator: (RTAverageDecorator new withLabel; labelConvertion: [ :value | ' average = ', (value round: 2) asString ]). b build. b
Before:
Now:
Not a big deal, but this is much nicer.
Cheers, Alexandre -- _,.;:~^~:;._,.;:~^~:;._,.;:~^~:;._,.;:~^~:;._,.;: Alexandre Bergel http://www.bergel.eu ^~:;._,.;:~^~:;._,.;:~^~:;._,.;:~^~:;._,.;:~^~:;.
Moose-dev mailing list Moose-dev@iam.unibe.ch https://www.iam.unibe.ch/mailman/listinfo/moose-dev

Ourah !
On Thu, Apr 23, 2015 at 2:48 PM, Alexandre Bergel alexandre.bergel@me.com wrote:
Hi!
Just to share a bit our progresses about Grapher.
***** Box plots *****
A box and whisker plot is a diagram showing statistical distribution of a data set. This is highly important as soon as you need to understand the distribution of some data.
Here is an example: b := RTGrapher new. b extent: 50 @ 300. ds := RTBoxPlotDataSet new. ds points: #(4.3 5.1 3.9 4.5 4.4 4.9 5.0 4.7 4.1 4.6 4.4 4.3 4.8 4.4 4.2 4.5 4.4). b add: ds.
b axisX noLabel; noTick. b
Another example with outliers:
b := RTGrapher new. b extent: 50 @ 300. ds := RTBoxPlotDataSet new. ds points: #(14 15 16 16 17 17 17 17 17 18 18 18 18 18 18 19 19 19 20 20 20 20 20 20 21 21 22 23 24 24 29). b add: ds.
b axisX noLabel; noTick. b
Slightly more elaborated example:
b := RTGrapher new. b extent: 400 @ 200. RTShape withAllSubclasses do: [ :cls | ds := RTBoxPlotDataSet new. ds points: (cls methods collect: #numberOfLinesOfCode). b add: ds. ].
b
***** Tick Improvement *****
Ticks are now much nicer. Consider the following script:
b := RTGrapher new. ds := RTDataSet new. ds dotShape color: Color red. ds points: #(5 1 20 8). b add: ds. b addDecorator: (RTAverageDecorator new withLabel; labelConvertion: [ :value | ' average = ', (value round: 2) asString ]). b build. b
Before:
Now:
Not a big deal, but this is much nicer.
Cheers, Alexandre -- _,.;:~^~:;._,.;:~^~:;._,.;:~^~:;._,.;:~^~:;._,.;: Alexandre Bergel http://www.bergel.eu ^~:;._,.;:~^~:;._,.;:~^~:;._,.;:~^~:;._,.;:~^~:;.
Moose-dev mailing list Moose-dev@iam.unibe.ch https://www.iam.unibe.ch/mailman/listinfo/moose-dev

-
 Alexandre Bergel
 -
 phil@highoctane.be
 -
 Serge Stinckwich
 -
 Tudor Girba