
Hi!
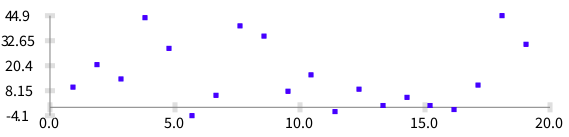
Milton did a wonderful improvement of Grapher. Consider the following expression: ((1 to: 20) collect: [ :v | 50 atRandom - 5.1 ]) plot
It produces:
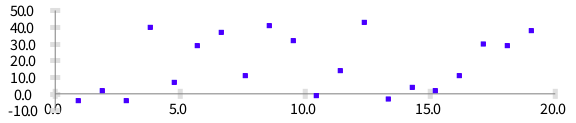
As you can see, the horizontal bar is not in the 0 on the Y axis. And this is quite a problem actually. Excel does it much better. This is now fixed, in the last version of Roassal we have
Milton has implemented an optimization algorithm that identify the optimal minimum & maximum value on the axis, and the optimal number of ticks, to have a pleasant reading.
Enjoy!
Cheers, Alexandre

This is really nice!
Although, it shows another opportunity to make it even nicer. In the new graph, it does down to -10 on the vertical, where the tick mark overwrites the horizontal 0.0 label. It looks like the plot points could also overwrite the labels if they descended that far, too. so, the next incremental enhancement would be to adjust the horizontal labels to be below the min Y locations, right?
-cbc
On Thu, Mar 19, 2015 at 2:48 PM, Alexandre Bergel alexandre.bergel@me.com wrote:
Hi!
Milton did a wonderful improvement of Grapher. Consider the following expression: ((1 to: 20) collect: [ :v | 50 atRandom - 5.1 ]) plot
It produces:
As you can see, the horizontal bar is not in the 0 on the Y axis. And this is quite a problem actually. Excel does it much better. This is now fixed, in the last version of Roassal we have
Milton has implemented an optimization algorithm that identify the optimal minimum & maximum value on the axis, and the optimal number of ticks, to have a pleasant reading.
Enjoy!
Cheers, Alexandre -- _,.;:~^~:;._,.;:~^~:;._,.;:~^~:;._,.;:~^~:;._,.;: Alexandre Bergel http://www.bergel.eu ^~:;._,.;:~^~:;._,.;:~^~:;._,.;:~^~:;._,.;:~^~:;.
Moose-dev mailing list Moose-dev@iam.unibe.ch https://www.iam.unibe.ch/mailman/listinfo/moose-dev
Yes indeed!
Alexandre
Le 20 mars 2015 à 11:49, Chris Cunningham cunningham.cb@gmail.com a écrit :
This is really nice!
Although, it shows another opportunity to make it even nicer. In the new graph, it does down to -10 on the vertical, where the tick mark overwrites the horizontal 0.0 label. It looks like the plot points could also overwrite the labels if they descended that far, too. so, the next incremental enhancement would be to adjust the horizontal labels to be below the min Y locations, right?
-cbc
On Thu, Mar 19, 2015 at 2:48 PM, Alexandre Bergel alexandre.bergel@me.com wrote: Hi!
Milton did a wonderful improvement of Grapher. Consider the following expression: ((1 to: 20) collect: [ :v | 50 atRandom - 5.1 ]) plot
It produces: <Screen Shot 2015-03-19 at 6.41.04 PM.png>
As you can see, the horizontal bar is not in the 0 on the Y axis. And this is quite a problem actually. Excel does it much better. This is now fixed, in the last version of Roassal we have
<Screen Shot 2015-03-19 at 6.47.27 PM.png>
Milton has implemented an optimization algorithm that identify the optimal minimum & maximum value on the axis, and the optimal number of ticks, to have a pleasant reading.
Enjoy!
Cheers, Alexandre -- _,.;:~^~:;._,.;:~^~:;._,.;:~^~:;._,.;:~^~:;._,.;: Alexandre Bergel http://www.bergel.eu ^~:;._,.;:~^~:;._,.;:~^~:;._,.;:~^~:;._,.;:~^~:;.
Moose-dev mailing list Moose-dev@iam.unibe.ch https://www.iam.unibe.ch/mailman/listinfo/moose-dev
Moose-dev mailing list Moose-dev@iam.unibe.ch https://www.iam.unibe.ch/mailman/listinfo/moose-dev
-
 Alexandre Bergel
 -
 Chris Cunningham