
11 Apr
2016
11 Apr
'16
5:18 a.m.
Hi!
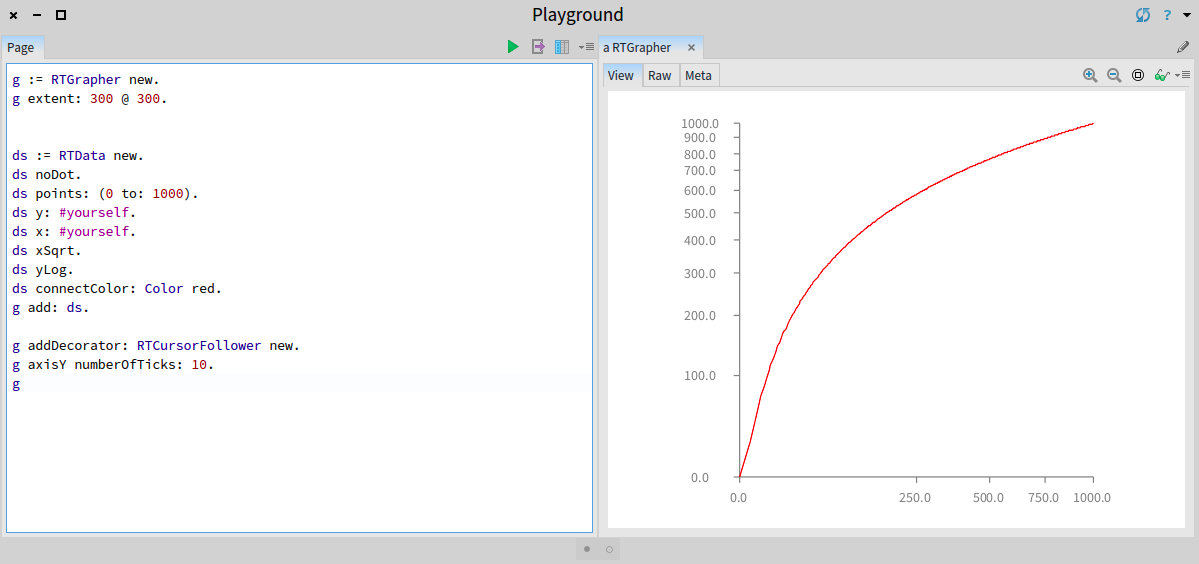
This has been on our todo list for a long long time. Grapher now support scales along the X- and Y- axis.
The following example uses a square root transformation on the X-axis and a log transformation on the Y-Axis: -=-=-=-=-=-=-=-=-=-=-=-=-=-=-=-= g := RTGrapher new. g extent: 300 @ 300.
ds := RTData new. ds noDot. ds points: (0 to: 1000). ds y: #yourself. ds x: #yourself. ds xSqrt. ds yLog. ds connectColor: Color red. g add: ds.
g addDecorator: RTCursorFollower new. g axisY numberOfTicks: 10. g -=-=-=-=-=-=-=-=-=-=-=-=-=-=-=-=
Cheers, Alexandre
--
_,.;:~^~:;._,.;:~^~:;._,.;:~^~:;._,.;:~^~:;._,.;:
Alexandre Bergel http://www.bergel.eu
^~:;._,.;:~^~:;._,.;:~^~:;._,.;:~^~:;._,.;:~^~:;.
3653
Age (days ago)
3653
Last active (days ago)
0 comments
1 participants
participants (1)
-
 Alexandre Bergel