
Hi All,
I was looking for a way to get a title on a graph made with RTGrapher. I have so many open that sometimes I forget which ones is which. A title would help but I cannot find a straightforward way to add one. Is this possible?
-- Does this mail seem too brief? Sorry for that, I don’t mean to be rude! Please see http://emailcharter.org .
Johan Fabry - http://pleiad.cl/~jfabry PLEIAD and RyCh labs - Computer Science Department (DCC) - University of Chile

+1
Yes how to set the SystemWindow labels
On Mon, Dec 12, 2016 at 08:47 Johan Fabry jfabry@dcc.uchile.cl wrote:
Hi All,
I was looking for a way to get a title on a graph made with RTGrapher. I have so many open that sometimes I forget which ones is which. A title would help but I cannot find a straightforward way to add one. Is this possible?
--
Does this mail seem too brief? Sorry for that, I don’t mean to be rude! Please see http://emailcharter.org .
Johan Fabry - http://pleiad.cl/~jfabry
PLEIAD and RyCh labs - Computer Science Department (DCC) - University of Chile
Moose-dev mailing list
Moose-dev@list.inf.unibe.ch

Hi,
If you use the integration of Roassal from Glamour, you can use openWithToolbarEntitled:. For example:
| b ds | b := RTGrapher new. b extent: 900 @ 200. ds := RTData new. ds interaction highlight. ds points: RTShape withAllSubclasses. ds barShape width: 10. ds y: #numberOfMethods. ds barChartWithBarTitle: #name. b add: ds. b openWithToolbarEntitled: 'My graph’
Cheers, Doru
On Dec 12, 2016, at 12:58 PM, Kjell Godo squeaklist@gmail.com wrote:
+1
Yes how to set the SystemWindow labels
On Mon, Dec 12, 2016 at 08:47 Johan Fabry jfabry@dcc.uchile.cl wrote: Hi All,
I was looking for a way to get a title on a graph made with RTGrapher. I have so many open that sometimes I forget which ones is which. A title would help but I cannot find a straightforward way to add one. Is this possible?
--
Does this mail seem too brief? Sorry for that, I don’t mean to be rude! Please see http://emailcharter.org .
Johan Fabry - http://pleiad.cl/~jfabry
PLEIAD and RyCh labs - Computer Science Department (DCC) - University of Chile
Moose-dev mailing list
Moose-dev@list.inf.unibe.ch
https://www.list.inf.unibe.ch/listinfo/moose-dev
Moose-dev mailing list Moose-dev@list.inf.unibe.ch https://www.list.inf.unibe.ch/listinfo/moose-dev
-- www.tudorgirba.com www.feenk.com
"Be rather willing to give than demanding to get."
+1
On Mon, Dec 12, 2016 at 10:10 Tudor Girba tudor@tudorgirba.com wrote:
Hi,
If you use the integration of Roassal from Glamour, you can use openWithToolbarEntitled:. For example:
| b ds |
b := RTGrapher new.
b extent: 900 @ 200.
ds := RTData new.
ds interaction highlight.
ds points: RTShape withAllSubclasses.
ds barShape width: 10.
ds y: #numberOfMethods.
ds barChartWithBarTitle: #name.
b add: ds.
b openWithToolbarEntitled: 'My graph’
Cheers,
Doru
On Dec 12, 2016, at 12:58 PM, Kjell Godo squeaklist@gmail.com wrote:
+1
Yes how to set the SystemWindow labels
On Mon, Dec 12, 2016 at 08:47 Johan Fabry jfabry@dcc.uchile.cl wrote:
Hi All,
I was looking for a way to get a title on a graph made with RTGrapher. I
have so many open that sometimes I forget which ones is which. A title would help but I cannot find a straightforward way to add one. Is this possible?
--
Does this mail seem too brief? Sorry for that, I don’t mean to be rude!
Please see http://emailcharter.org .
Johan Fabry - http://pleiad.cl/~jfabry
PLEIAD and RyCh labs - Computer Science Department (DCC) -
University of Chile
Moose-dev mailing list
Moose-dev@list.inf.unibe.ch
Moose-dev mailing list
Moose-dev@list.inf.unibe.ch
--
www.tudorgirba.com
www.feenk.com
"Be rather willing to give than demanding to get."
Moose-dev mailing list
Moose-dev@list.inf.unibe.ch
Thanks Doru but I am using it inside the inspector already and I need the graph to show up in the next pane. openWithToolbarEntitled: makes it open in a new window, which breaks the flow. :-(
-- Does this mail seem too brief? Sorry for that, I don’t mean to be rude! Please see http://emailcharter.org .
Johan Fabry - http://pleiad.cl/~jfabry PLEIAD and RyCh labs - Computer Science Department (DCC) - University of Chile
On 12 Dec 2016, at 15:10, Tudor Girba tudor@tudorgirba.com wrote:
Hi,
If you use the integration of Roassal from Glamour, you can use openWithToolbarEntitled:. For example:
| b ds | b := RTGrapher new. b extent: 900 @ 200. ds := RTData new. ds interaction highlight. ds points: RTShape withAllSubclasses. ds barShape width: 10. ds y: #numberOfMethods. ds barChartWithBarTitle: #name. b add: ds. b openWithToolbarEntitled: 'My graph’
Cheers, Doru
On Dec 12, 2016, at 12:58 PM, Kjell Godo squeaklist@gmail.com wrote:
+1
Yes how to set the SystemWindow labels
On Mon, Dec 12, 2016 at 08:47 Johan Fabry jfabry@dcc.uchile.cl wrote: Hi All,
I was looking for a way to get a title on a graph made with RTGrapher. I have so many open that sometimes I forget which ones is which. A title would help but I cannot find a straightforward way to add one. Is this possible?
--
Does this mail seem too brief? Sorry for that, I don’t mean to be rude! Please see http://emailcharter.org .
Johan Fabry - http://pleiad.cl/~jfabry
PLEIAD and RyCh labs - Computer Science Department (DCC) - University of Chile
Moose-dev mailing list
Moose-dev@list.inf.unibe.ch
https://www.list.inf.unibe.ch/listinfo/moose-dev
Moose-dev mailing list Moose-dev@list.inf.unibe.ch https://www.list.inf.unibe.ch/listinfo/moose-dev
-- www.tudorgirba.com www.feenk.com
"Be rather willing to give than demanding to get."
Moose-dev mailing list Moose-dev@list.inf.unibe.ch https://www.list.inf.unibe.ch/listinfo/moose-dev

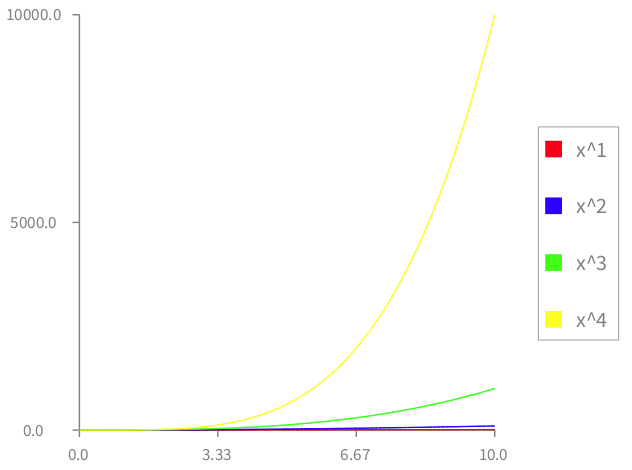
You can have legends, such as in:
-=-=-=-=-=-=-=-=-=-=-=-= b := RTGrapher new. b extent: 300 @ 300. (Array with: Color red with: Color blue with: Color green with: Color yellow) doWithIndex: [ :color :i | ds := RTData new. ds label: 'x^', i asString. ds dotShape ellipse size: 0. ds points: (0.0 to: 10.0 by: 0.1). ds connectColor: color. ds x: #yourself. ds y: [ :v | v raisedTo: i ]. b add: ds. ]. b axisXWithNumberOfTicks: 3. b axisYWithNumberOfTicks: 4. b legend right. ^ b -=-=-=-=-=-=-=-=-=-=-=-=
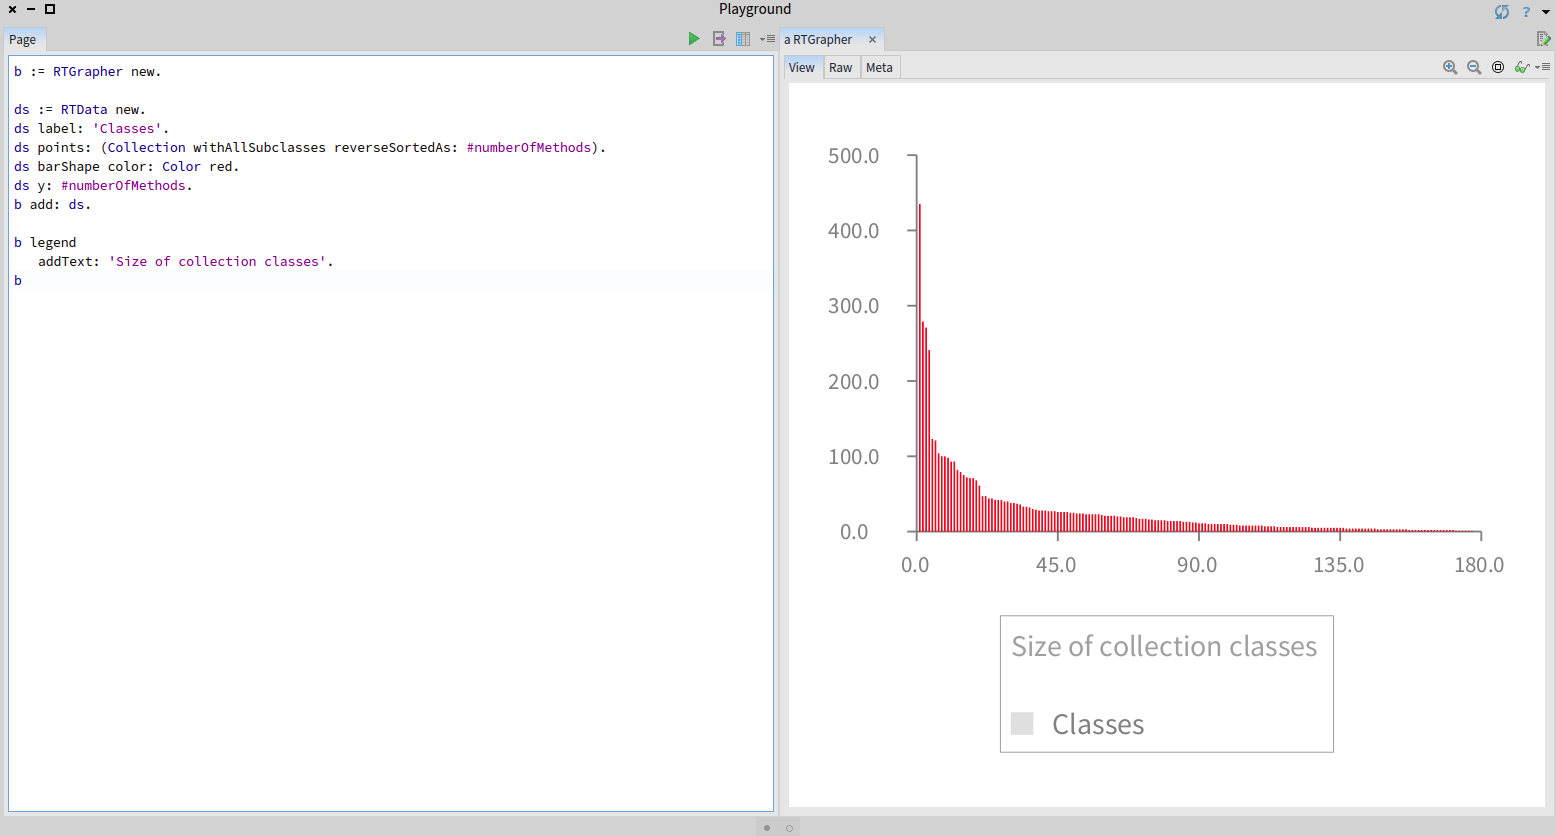
Here is another example:
-=-=-=-=-=-=-=-= b := RTGrapher new.
ds := RTData new. ds label: 'Classes'. ds points: (Collection withAllSubclasses reverseSortedAs: #numberOfMethods). ds barShape color: Color red. ds y: #numberOfMethods. b add: ds.
b legend addText: 'Size of collection classes'. b -=-=-=-=-=-=-=-=
Cheers, Alexandre
On Dec 12, 2016, at 5:47 PM, Johan Fabry jfabry@dcc.uchile.cl wrote:
Hi All,
I was looking for a way to get a title on a graph made with RTGrapher. I have so many open that sometimes I forget which ones is which. A title would help but I cannot find a straightforward way to add one. Is this possible?
-- Does this mail seem too brief? Sorry for that, I don’t mean to be rude! Please see http://emailcharter.org .
Johan Fabry - http://pleiad.cl/~jfabry PLEIAD and RyCh labs - Computer Science Department (DCC) - University of Chile
Moose-dev mailing list Moose-dev@list.inf.unibe.ch https://www.list.inf.unibe.ch/listinfo/moose-dev
+1 legends
but how are you supposed to change the SystemWindow label programmatically in general?
My guess is that the
open openOn:
Methods always return aSystemWindow so then you can do
aSystemWindow label: 'A Window Title'
( b open ) label: 'A Window Title'
correct me if i am wrong
On Mon, Dec 12, 2016 at 10:01 Alexandre Bergel alexandre.bergel@me.com wrote:
You can have legends, such as in:
-=-=-=-=-=-=-=-=-=-=-=-= b := RTGrapher new. b extent: 300 @ 300.
(Array with: Color red with: Color blue with: Color green with: Color yellow) doWithIndex: [ :color :i | ds := RTData new. ds label: 'x^', i asString. ds dotShape ellipse size: 0. ds points: (0.0 to: 10.0 by: 0.1). ds connectColor: color. ds x: #yourself. ds y: [ :v | v raisedTo: i ]. b add: ds. ].
b axisXWithNumberOfTicks: 3. b axisYWithNumberOfTicks: 4. b legend right. ^ b -=-=-=-=-=-=-=-=-=-=-=-=
Here is another example:
-=-=-=-=-=-=-=-= b := RTGrapher new.
ds := RTData new. ds label: 'Classes'. ds points: (Collection withAllSubclasses reverseSortedAs: #numberOfMethods). ds barShape color: Color red. ds y: #numberOfMethods. b add: ds.
b legend addText: 'Size of collection classes'. b -=-=-=-=-=-=-=-=
Cheers, Alexandre
On Dec 12, 2016, at 5:47 PM, Johan Fabry jfabry@dcc.uchile.cl wrote:
Hi All,
I was looking for a way to get a title on a graph made with RTGrapher. I have so many open that sometimes I forget which ones is which. A title would help but I cannot find a straightforward way to add one. Is this possible?
-- Does this mail seem too brief? Sorry for that, I don’t mean to be rude! Please see http://emailcharter.org .
Johan Fabry - http://pleiad.cl/~jfabry PLEIAD and RyCh labs - Computer Science Department (DCC) - University of Chile
Moose-dev mailing list Moose-dev@list.inf.unibe.ch https://www.list.inf.unibe.ch/listinfo/moose-dev
-- _,.;:~^~:;._,.;:~^~:;._,.;:~^~:;._,.;:~^~:;._,.;: Alexandre Bergel http://www.bergel.eu ^~:;._,.;:~^~:;._,.;:~^~:;._,.;:~^~:;._,.;:~^~:;.
Moose-dev mailing list
Moose-dev@list.inf.unibe.ch
Thanks Alex but I would just like a title, on the top of the graph. There is no way to put legends at the top and also they behave strangely if you don’t specify a label for the dataset.
-- Does this mail seem too brief? Sorry for that, I don’t mean to be rude! Please see http://emailcharter.org http://emailcharter.org/ .
Johan Fabry - http://pleiad.cl/~jfabry PLEIAD and RyCh labs - Computer Science Department (DCC) - University of Chile
On 12 Dec 2016, at 15:00, Alexandre Bergel alexandre.bergel@me.com wrote:
You can have legends, such as in:
-=-=-=-=-=-=-=-=-=-=-=-= b := RTGrapher new. b extent: 300 @ 300.
(Array with: Color red with: Color blue with: Color green with: Color yellow) doWithIndex: [ :color :i | ds := RTData new. ds label: 'x^', i asString. ds dotShape ellipse size: 0. ds points: (0.0 to: 10.0 by: 0.1). ds connectColor: color. ds x: #yourself. ds y: [ :v | v raisedTo: i ]. b add: ds. ].
b axisXWithNumberOfTicks: 3. b axisYWithNumberOfTicks: 4. b legend right. ^ b -=-=-=-=-=-=-=-=-=-=-=-= <Screen Shot 2016-12-12 at 6.52.11 PM.png>
Here is another example:
-=-=-=-=-=-=-=-= b := RTGrapher new.
ds := RTData new. ds label: 'Classes'. ds points: (Collection withAllSubclasses reverseSortedAs: #numberOfMethods). ds barShape color: Color red. ds y: #numberOfMethods. b add: ds.
b legend addText: 'Size of collection classes'. b -=-=-=-=-=-=-=-=
<Screen Shot 2016-12-12 at 6.57.53 PM.png>
Cheers, Alexandre
On Dec 12, 2016, at 5:47 PM, Johan Fabry <jfabry@dcc.uchile.cl mailto:jfabry@dcc.uchile.cl> wrote:
Hi All,
I was looking for a way to get a title on a graph made with RTGrapher. I have so many open that sometimes I forget which ones is which. A title would help but I cannot find a straightforward way to add one. Is this possible?
-- Does this mail seem too brief? Sorry for that, I don’t mean to be rude! Please see http://emailcharter.org http://emailcharter.org/ .
Johan Fabry - http://pleiad.cl/~jfabry http://pleiad.cl/~jfabry PLEIAD and RyCh labs - Computer Science Department (DCC) - University of Chile
Moose-dev mailing list Moose-dev@list.inf.unibe.ch mailto:Moose-dev@list.inf.unibe.ch https://www.list.inf.unibe.ch/listinfo/moose-dev
-- _,.;:~^~:;._,.;:~^~:;._,.;:~^~:;._,.;:~^~:;._,.;: Alexandre Bergel http://www.bergel.eu http://www.bergel.eu/ ^~:;._,.;:~^~:;._,.;:~^~:;._,.;:~^~:;._,.;:~^~:;.
Moose-dev mailing list Moose-dev@list.inf.unibe.ch https://www.list.inf.unibe.ch/listinfo/moose-dev
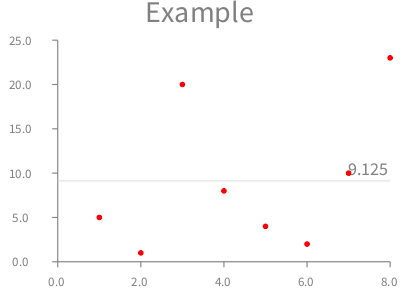
Hi Johan!
I have just created a decorator for this. (you need to update Roassal). Look:
| b ds | b := RTGrapher new. ds := RTData new. ds dotShape color: Color red. ds points: #(5 1 20 8 4 2 10 23). b add: ds. b addDecorator: (RTAverageDecorator new withLabel: #asFloat). b addDecorator: (RTTitleDecorator new height: 20; title: 'Example'). ^ b
On Dec 12, 2016, at 9:36 PM, Johan Fabry jfabry@dcc.uchile.cl wrote:
Thanks Alex but I would just like a title, on the top of the graph. There is no way to put legends at the top and also they behave strangely if you don’t specify a label for the dataset.
-- Does this mail seem too brief? Sorry for that, I don’t mean to be rude! Please see http://emailcharter.org .
Johan Fabry - http://pleiad.cl/~jfabry PLEIAD and RyCh labs - Computer Science Department (DCC) - University of Chile
On 12 Dec 2016, at 15:00, Alexandre Bergel alexandre.bergel@me.com wrote:
You can have legends, such as in:
-=-=-=-=-=-=-=-=-=-=-=-= b := RTGrapher new. b extent: 300 @ 300.
(Array with: Color red with: Color blue with: Color green with: Color yellow) doWithIndex: [ :color :i | ds := RTData new. ds label: 'x^', i asString. ds dotShape ellipse size: 0. ds points: (0.0 to: 10.0 by: 0.1). ds connectColor: color. ds x: #yourself. ds y: [ :v | v raisedTo: i ]. b add: ds. ].
b axisXWithNumberOfTicks: 3. b axisYWithNumberOfTicks: 4. b legend right. ^ b -=-=-=-=-=-=-=-=-=-=-=-= <Screen Shot 2016-12-12 at 6.52.11 PM.png>
Here is another example:
-=-=-=-=-=-=-=-= b := RTGrapher new.
ds := RTData new. ds label: 'Classes'. ds points: (Collection withAllSubclasses reverseSortedAs: #numberOfMethods). ds barShape color: Color red. ds y: #numberOfMethods. b add: ds.
b legend addText: 'Size of collection classes'. b -=-=-=-=-=-=-=-=
<Screen Shot 2016-12-12 at 6.57.53 PM.png>
Cheers, Alexandre
On Dec 12, 2016, at 5:47 PM, Johan Fabry jfabry@dcc.uchile.cl wrote:
Hi All,
I was looking for a way to get a title on a graph made with RTGrapher. I have so many open that sometimes I forget which ones is which. A title would help but I cannot find a straightforward way to add one. Is this possible?
-- Does this mail seem too brief? Sorry for that, I don’t mean to be rude! Please see http://emailcharter.org .
Johan Fabry - http://pleiad.cl/~jfabry PLEIAD and RyCh labs - Computer Science Department (DCC) - University of Chile
Moose-dev mailing list Moose-dev@list.inf.unibe.ch https://www.list.inf.unibe.ch/listinfo/moose-dev
-- _,.;:~^~:;._,.;:~^~:;._,.;:~^~:;._,.;:~^~:;._,.;: Alexandre Bergel http://www.bergel.eu ^~:;._,.;:~^~:;._,.;:~^~:;._,.;:~^~:;._,.;:~^~:;.
Moose-dev mailing list Moose-dev@list.inf.unibe.ch https://www.list.inf.unibe.ch/listinfo/moose-dev
Moose-dev mailing list Moose-dev@list.inf.unibe.ch https://www.list.inf.unibe.ch/listinfo/moose-dev
Great, thanks a lot, Alex !
-- Does this mail seem too brief? Sorry for that, I don’t mean to be rude! Please see http://emailcharter.org http://emailcharter.org/ .
Johan Fabry - http://pleiad.cl/~jfabry PLEIAD and RyCh labs - Computer Science Department (DCC) - University of Chile
On 13 Dec 2016, at 05:05, Alexandre Bergel alexandre.bergel@me.com wrote:
Hi Johan!
I have just created a decorator for this. (you need to update Roassal). Look:
| b ds | b := RTGrapher new. ds := RTData new. ds dotShape color: Color red. ds points: #(5 1 20 8 4 2 10 23). b add: ds. b addDecorator: (RTAverageDecorator new withLabel: #asFloat). b addDecorator: (RTTitleDecorator new height: 20; title: 'Example'). ^ b
<Screen Shot 2016-12-13 at 9.03.01 AM.png>
On Dec 12, 2016, at 9:36 PM, Johan Fabry <jfabry@dcc.uchile.cl mailto:jfabry@dcc.uchile.cl> wrote:
Thanks Alex but I would just like a title, on the top of the graph. There is no way to put legends at the top and also they behave strangely if you don’t specify a label for the dataset.
-- Does this mail seem too brief? Sorry for that, I don’t mean to be rude! Please see http://emailcharter.org http://emailcharter.org/ .
Johan Fabry - http://pleiad.cl/~jfabry PLEIAD and RyCh labs - Computer Science Department (DCC) - University of Chile
On 12 Dec 2016, at 15:00, Alexandre Bergel alexandre.bergel@me.com wrote:
You can have legends, such as in:
-=-=-=-=-=-=-=-=-=-=-=-= b := RTGrapher new. b extent: 300 @ 300.
(Array with: Color red with: Color blue with: Color green with: Color yellow) doWithIndex: [ :color :i | ds := RTData new. ds label: 'x^', i asString. ds dotShape ellipse size: 0. ds points: (0.0 to: 10.0 by: 0.1). ds connectColor: color. ds x: #yourself. ds y: [ :v | v raisedTo: i ]. b add: ds. ].
b axisXWithNumberOfTicks: 3. b axisYWithNumberOfTicks: 4. b legend right. ^ b -=-=-=-=-=-=-=-=-=-=-=-= <Screen Shot 2016-12-12 at 6.52.11 PM.png>
Here is another example:
-=-=-=-=-=-=-=-= b := RTGrapher new.
ds := RTData new. ds label: 'Classes'. ds points: (Collection withAllSubclasses reverseSortedAs: #numberOfMethods). ds barShape color: Color red. ds y: #numberOfMethods. b add: ds.
b legend addText: 'Size of collection classes'. b -=-=-=-=-=-=-=-=
<Screen Shot 2016-12-12 at 6.57.53 PM.png>
Cheers, Alexandre
On Dec 12, 2016, at 5:47 PM, Johan Fabry jfabry@dcc.uchile.cl wrote:
Hi All,
I was looking for a way to get a title on a graph made with RTGrapher. I have so many open that sometimes I forget which ones is which. A title would help but I cannot find a straightforward way to add one. Is this possible?
-- Does this mail seem too brief? Sorry for that, I don’t mean to be rude! Please see http://emailcharter.org .
Johan Fabry - http://pleiad.cl/~jfabry PLEIAD and RyCh labs - Computer Science Department (DCC) - University of Chile
Moose-dev mailing list Moose-dev@list.inf.unibe.ch https://www.list.inf.unibe.ch/listinfo/moose-dev
-- _,.;:~^~:;._,.;:~^~:;._,.;:~^~:;._,.;:~^~:;._,.;: Alexandre Bergel http://www.bergel.eu ^~:;._,.;:~^~:;._,.;:~^~:;._,.;:~^~:;._,.;:~^~:;.
Moose-dev mailing list Moose-dev@list.inf.unibe.ch https://www.list.inf.unibe.ch/listinfo/moose-dev
Moose-dev mailing list Moose-dev@list.inf.unibe.ch https://www.list.inf.unibe.ch/listinfo/moose-dev
-- _,.;:~^~:;._,.;:~^~:;._,.;:~^~:;._,.;:~^~:;._,.;: Alexandre Bergel http://www.bergel.eu http://www.bergel.eu/ ^~:;._,.;:~^~:;._,.;:~^~:;._,.;:~^~:;._,.;:~^~:;.
Moose-dev mailing list Moose-dev@list.inf.unibe.ch https://www.list.inf.unibe.ch/listinfo/moose-dev
-
 Alexandre Bergel
 -
 Johan Fabry
 -
 Kjell Godo
 -
 Tudor Girba