
Hi
I have a bag
b := Bag new. b add: 1 withOccurrences: 5. b add: 3 withOccurrences: 4. b add: 6. b
and I would like to display it as an histogram with roassal.
Stef

You can try something like that:
b := Bag new. b add: 1 withOccurrences: 5. b add: 3 withOccurrences: 4. b add: 6. b.
v := RTDoubleGraphBuilder new. ds:=RTStackedDataSet new. ds interaction popup. ds points: b valuesAndCounts keys. ds y:[:c|cb valuesAndCounts at: c]. ds barShape color: Color red; width: 15. v add: ds. v axisX. v axisYWithNumberOfTicks: 5. v open
I'm working with an old version of Roassal (version 761 of the Roassal package) then I don't know if it's working with a more recent version.
Otherwise there is examples in the Grapher Menu of the Roassal examples.
Regards,
-------------- Brice Govin PhD student in RMoD research team at INRIA Lille Software Engineer at THALES AIR SYSTEMS Rungis ENSTA-Bretagne ENSI2014 22 Avenue du General Leclerc 92340 BOURG-LA-REINE
________________________________________ De : moose-dev-bounces@list.inf.unibe.ch moose-dev-bounces@list.inf.unibe.ch de la part de stepharo stepharo@free.fr Envoyé : lundi 15 février 2016 15:22 À : Moose-related development Objet : [Moose-dev] How to display an histogram given a bag
Hi
I have a bag
b := Bag new. b add: 1 withOccurrences: 5. b add: 3 withOccurrences: 4. b add: 6. b
and I would like to display it as an histogram with roassal.
Stef _______________________________________________ Moose-dev mailing list Moose-dev@list.inf.unibe.ch https://www.list.inf.unibe.ch/listinfo/moose-dev

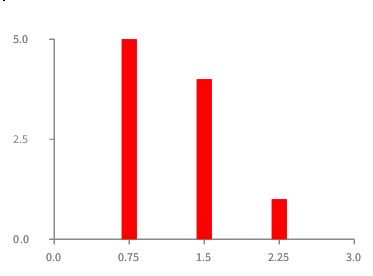
If you want to use the last version: b := Bag new. b add: 1 withOccurrences: 5. b add: 3 withOccurrences: 4. b add: 6. b.
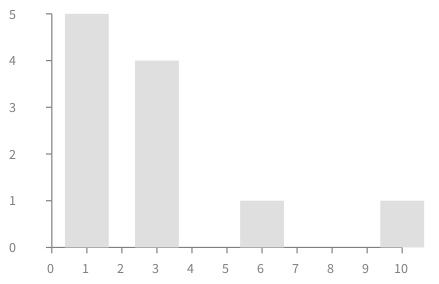
v := RTGrapher new. ds:=RTData new. ds interaction popup. ds points: b valuesAndCounts keys. ds y:[:c|b valuesAndCounts at: c]. ds barShape color: Color red; width: 15. v add: ds. v axisX. v axisYWithNumberOfTicks: 3. v build. v open
But, the abscissa labels are not accurate: [cid:image001.png@01D1680A.0EF73A20]
Vincent
De : moose-dev-bounces@list.inf.unibe.ch [mailto:moose-dev-bounces@list.inf.unibe.ch] De la part de Brice GOVIN Envoyé : lundi 15 février 2016 15:54 À : Moose-related development Objet : [Moose-dev] Re: How to display an histogram given a bag
You can try something like that:
b := Bag new. b add: 1 withOccurrences: 5. b add: 3 withOccurrences: 4. b add: 6. b.
v := RTDoubleGraphBuilder new. ds:=RTStackedDataSet new. ds interaction popup. ds points: b valuesAndCounts keys. ds y:[:c|cb valuesAndCounts at: c]. ds barShape color: Color red; width: 15. v add: ds. v axisX. v axisYWithNumberOfTicks: 5. v open
I'm working with an old version of Roassal (version 761 of the Roassal package) then I don't know if it's working with a more recent version.
Otherwise there is examples in the Grapher Menu of the Roassal examples.
Regards,
-------------- Brice Govin PhD student in RMoD research team at INRIA Lille Software Engineer at THALES AIR SYSTEMS Rungis ENSTA-Bretagne ENSI2014 22 Avenue du General Leclerc 92340 BOURG-LA-REINE
________________________________________ De : moose-dev-bounces@list.inf.unibe.chmailto:moose-dev-bounces@list.inf.unibe.ch <moose-dev-bounces@list.inf.unibe.chmailto:moose-dev-bounces@list.inf.unibe.ch> de la part de stepharo <stepharo@free.frmailto:stepharo@free.fr> Envoyé : lundi 15 février 2016 15:22 À : Moose-related development Objet : [Moose-dev] How to display an histogram given a bag
Hi
I have a bag
b := Bag new. b add: 1 withOccurrences: 5. b add: 3 withOccurrences: 4. b add: 6. b
and I would like to display it as an histogram with roassal.
Stef _______________________________________________ Moose-dev mailing list Moose-dev@list.inf.unibe.chmailto:Moose-dev@list.inf.unibe.ch https://www.list.inf.unibe.ch/listinfo/moose-dev
________________________________
Ce message et les pièces jointes sont confidentiels et réservés à l'usage exclusif de ses destinataires. Il peut également être protégé par le secret professionnel. Si vous recevez ce message par erreur, merci d'en avertir immédiatement l'expéditeur et de le détruire. L'intégrité du message ne pouvant être assurée sur Internet, la responsabilité de Worldline ne pourra être recherchée quant au contenu de ce message. Bien que les meilleurs efforts soient faits pour maintenir cette transmission exempte de tout virus, l'expéditeur ne donne aucune garantie à cet égard et sa responsabilité ne saurait être recherchée pour tout dommage résultant d'un virus transmis.
This e-mail and the documents attached are confidential and intended solely for the addressee; it may also be privileged. If you receive this e-mail in error, please notify the sender immediately and destroy it. As its integrity cannot be secured on the Internet, the Worldline liability cannot be triggered for the message content. Although the sender endeavours to maintain a computer virus-free network, the sender does not warrant that this transmission is virus-free and will not be liable for any damages resulting from any virus transmitted.
Thanks vincent but how can I get a real histogram? with empty columns for empty values?
Le 15/2/16 16:00, Blondeau Vincent a écrit :
If you want to use the last version:
b := Bag new.
b add: 1 withOccurrences: 5.b add: 3 withOccurrences: 4.
b add: 6.
b.
v := RTGrapher new.
ds:=RTData new.
ds interaction popup.
ds points: b valuesAndCounts keys.
ds y:[:c|b valuesAndCounts at: c].
ds barShape color: Color red; width: 15.
v add: ds.
v axisX.
v axisYWithNumberOfTicks: 3.
v build.
v open
But, the abscissa labels are not accurate:
Vincent
*De :*moose-dev-bounces@list.inf.unibe.ch [mailto:moose-dev-bounces@list.inf.unibe.ch] *De la part de* Brice GOVIN *Envoyé :* lundi 15 février 2016 15:54 *À :* Moose-related development *Objet :* [Moose-dev] Re: How to display an histogram given a bag
You can try something like that:
/ b := Bag new. b add: 1 withOccurrences: 5. b add: 3 withOccurrences: 4. b add: 6. b.
v := RTDoubleGraphBuilder new.
ds:=RTStackedDataSet new.
ds interaction popup.
ds points: b valuesAndCounts keys.
ds y:[:c|cb valuesAndCounts at: c].
ds barShape color: Color red; width: 15.
v add: ds.
v axisX.
v axisYWithNumberOfTicks: 5.
v open/
I'm working with an old version of Roassal (version 761 of the Roassal package) then I don't know if it's working with a more recent version.
Otherwise there is examples in the Grapher Menu of the Roassal examples.
Regards,
Brice Govin PhD student in RMoD research team at INRIA Lille Software Engineer at THALES AIR SYSTEMS Rungis ENSTA-Bretagne ENSI2014 22 Avenue du General Leclerc 92340 BOURG-LA-REINE
De : moose-dev-bounces@list.inf.unibe.ch mailto:moose-dev-bounces@list.inf.unibe.ch <moose-dev-bounces@list.inf.unibe.ch mailto:moose-dev-bounces@list.inf.unibe.ch> de la part de stepharo <stepharo@free.fr mailto:stepharo@free.fr> Envoyé : lundi 15 février 2016 15:22 À : Moose-related development Objet : [Moose-dev] How to display an histogram given a bag
Hi
I have a bag
 b := Bag new.
 b add: 1 withOccurrences: 5.
 b add: 3 withOccurrences: 4.
 b add: 6.
 b
and I would like to display it as an histogram with roassal.
Stef _______________________________________________ Moose-dev mailing list Moose-dev@list.inf.unibe.ch mailto:Moose-dev@list.inf.unibe.ch https://www.list.inf.unibe.ch/listinfo/moose-dev
Ce message et les pièces jointes sont confidentiels et réservés à l'usage exclusif de ses destinataires. Il peut également être protégé par le secret professionnel. Si vous recevez ce message par erreur, merci d'en avertir immédiatement l'expéditeur et de le détruire. L'intégrité du message ne pouvant être assurée sur Internet, la responsabilité de Worldline ne pourra être recherchée quant au contenu de ce message. Bien que les meilleurs efforts soient faits pour maintenir cette transmission exempte de tout virus, l'expéditeur ne donne aucune garantie à cet égard et sa responsabilité ne saurait être recherchée pour tout dommage résultant d'un virus transmis.
This e-mail and the documents attached are confidential and intended solely for the addressee; it may also be privileged. If you receive this e-mail in error, please notify the sender immediately and destroy it. As its integrity cannot be secured on the Internet, the Worldline liability cannot be triggered for the message content. Although the sender endeavours to maintain a computer virus-free network, the sender does not warrant that this transmission is virus-free and will not be liable for any damages resulting from any virus transmitted.
Moose-dev mailing list Moose-dev@list.inf.unibe.ch https://www.list.inf.unibe.ch/listinfo/moose-dev

Not sure that you are interested with that but with the implementation of ChartJs i have done for seaside:
stefExample: html | b chartData | b := Bag new. b add: 1 withOccurrences: 5. b add: 3 withOccurrences: 4. b add: 6. chartData := Chart2dData xObjects: (1 to: 6) function: [ :aValue | b valuesAndCounts at: aValue ifAbsent: 0 ]. chartData chartType: ChartBar. html render: (ChartJsComponent data: chartData)
[image: Images intégrées 1]
2016-02-15 17:11 GMT+01:00 stepharo stepharo@free.fr:
Thanks vincent but how can I get a real histogram? with empty columns for empty values?
Le 15/2/16 16:00, Blondeau Vincent a écrit :
If you want to use the last version:
 b := Bag new.

b add: 1 withOccurrences: 5.

 b add: 3 withOccurrences: 4.

 b add: 6.

 b.


v := RTGrapher new.

ds:=RTData new.

ds interaction popup.

ds points: b valuesAndCounts keys.

ds y:[:c|b valuesAndCounts at: c].

ds barShape color: Color red; width: 15.

v add: ds.

v axisX.

v axisYWithNumberOfTicks: 3.

v build.

v open
But, the abscissa labels are not accurate:
Vincent
*De :* moose-dev-bounces@list.inf.unibe.ch [ mailto:moose-dev-bounces@list.inf.unibe.ch moose-dev-bounces@list.inf.unibe.ch] *De la part de* Brice GOVIN *Envoyé :* lundi 15 février 2016 15:54 *À :* Moose-related development *Objet :* [Moose-dev] Re: How to display an histogram given a bag
You can try something like that:
b := Bag new. b add: 1 withOccurrences: 5. b add: 3withOccurrences: 4. b add: 6. b. v := RTDoubleGraphBuilder new. ds:=RTStackedDataSet new. ds interaction popup. ds points: b valuesAndCounts keys. ds y:[:c|cb valuesAndCounts at: c]. ds barShape color: Color red; width: 15. v add: ds. v axisX. v axisYWithNumberOfTicks: 5. v open*
I'm working with an old version of Roassal (version 761 of the Roassal package) then I don't know if it's working with a more recent version.
Otherwise there is examples in the Grapher Menu of the Roassal examples.
Regards,
Brice Govin PhD student in RMoD research team at INRIA Lille Software Engineer at THALES AIR SYSTEMS Rungis ENSTA-Bretagne ENSI2014 22 Avenue du General Leclerc 92340 BOURG-LA-REINE
De : moose-dev-bounces@list.inf.unibe.ch < moose-dev-bounces@list.inf.unibe.ch> de la part de stepharo < stepharo@free.fr> Envoyé : lundi 15 février 2016 15:22 À : Moose-related development Objet : [Moose-dev] How to display an histogram given a bag
Hi
I have a bag
 b := Bag new.
 b add: 1 withOccurrences: 5.
 b add: 3 withOccurrences: 4.
 b add: 6.
 b
and I would like to display it as an histogram with roassal.
Stef _______________________________________________ Moose-dev mailing list Moose-dev@list.inf.unibe.ch https://www.list.inf.unibe.ch/listinfo/moose-dev
Ce message et les pièces jointes sont confidentiels et réservés à l'usage exclusif de ses destinataires. Il peut également être protégé par le secret professionnel. Si vous recevez ce message par erreur, merci d'en avertir immédiatement l'expéditeur et de le détruire. L'intégrité du message ne pouvant être assurée sur Internet, la responsabilité de Worldline ne pourra être recherchée quant au contenu de ce message. Bien que les meilleurs efforts soient faits pour maintenir cette transmission exempte de tout virus, l'expéditeur ne donne aucune garantie à cet égard et sa responsabilité ne saurait être recherchée pour tout dommage résultant d'un virus transmis.
This e-mail and the documents attached are confidential and intended solely for the addressee; it may also be privileged. If you receive this e-mail in error, please notify the sender immediately and destroy it. As its integrity cannot be secured on the Internet, the Worldline liability cannot be triggered for the message content. Although the sender endeavours to maintain a computer virus-free network, the sender does not warrant that this transmission is virus-free and will not be liable for any damages resulting from any virus transmitted.
Moose-dev mailing listMoose-dev@list.inf.unibe.chhttps://www.list.inf.unibe.ch/listinfo/moose-dev
Moose-dev mailing list Moose-dev@list.inf.unibe.ch https://www.list.inf.unibe.ch/listinfo/moose-dev
So we really cannot do that with Roassal inside the image ?
BTW, what we have to load to use your ChartJs ?
Vincent
De : moose-dev-bounces@list.inf.unibe.ch [mailto:moose-dev-bounces@list.inf.unibe.ch] De la part de Guillaume Larcheveque Envoyé : lundi 15 février 2016 17:25 À : Moose-related development Objet : [Moose-dev] Re: How to display an histogram given a bag
Not sure that you are interested with that but with the implementation of ChartJs i have done for seaside:
stefExample: html | b chartData | b := Bag new. b add: 1 withOccurrences: 5. b add: 3 withOccurrences: 4. b add: 6. chartData := Chart2dData xObjects: (1 to: 6) function: [ :aValue | b valuesAndCounts at: aValue ifAbsent: 0 ]. chartData chartType: ChartBar. html render: (ChartJsComponent data: chartData)
[cid:image001.png@01D16816.7EC7AF40]
2016-02-15 17:11 GMT+01:00 stepharo <stepharo@free.frmailto:stepharo@free.fr>: Thanks vincent but how can I get a real histogram? with empty columns for empty values? Le 15/2/16 16:00, Blondeau Vincent a écrit : If you want to use the last version: b := Bag new. b add: 1 withOccurrences: 5. b add: 3 withOccurrences: 4. b add: 6. b.
v := RTGrapher new. ds:=RTData new. ds interaction popup. ds points: b valuesAndCounts keys. ds y:[:c|b valuesAndCounts at: c]. ds barShape color: Color red; width: 15. v add: ds. v axisX. v axisYWithNumberOfTicks: 3. v build. v open
But, the abscissa labels are not accurate: [cid:image002.png@01D16816.7EC7AF40]
Vincent
De : moose-dev-bounces@list.inf.unibe.chmailto:moose-dev-bounces@list.inf.unibe.ch [mailto:moose-dev-bounces@list.inf.unibe.ch] De la part de Brice GOVIN Envoyé : lundi 15 février 2016 15:54 À : Moose-related development Objet : [Moose-dev] Re: How to display an histogram given a bag
You can try something like that:
b := Bag new. b add: 1 withOccurrences: 5. b add: 3 withOccurrences: 4. b add: 6. b.
v := RTDoubleGraphBuilder new. ds:=RTStackedDataSet new. ds interaction popup. ds points: b valuesAndCounts keys. ds y:[:c|cb valuesAndCounts at: c]. ds barShape color: Color red; width: 15. v add: ds. v axisX. v axisYWithNumberOfTicks: 5. v open
I'm working with an old version of Roassal (version 761 of the Roassal package) then I don't know if it's working with a more recent version.
Otherwise there is examples in the Grapher Menu of the Roassal examples.
Regards,
-------------- Brice Govin PhD student in RMoD research team at INRIA Lille Software Engineer at THALES AIR SYSTEMS Rungis ENSTA-Bretagne ENSI2014 22 Avenue du General Leclerc 92340 BOURG-LA-REINE
________________________________________ De : moose-dev-bounces@list.inf.unibe.chmailto:moose-dev-bounces@list.inf.unibe.ch <moose-dev-bounces@list.inf.unibe.chmailto:moose-dev-bounces@list.inf.unibe.ch> de la part de stepharo <stepharo@free.frmailto:stepharo@free.fr> Envoyé : lundi 15 février 2016 15:22 À : Moose-related development Objet : [Moose-dev] How to display an histogram given a bag
Hi
I have a bag
b := Bag new. b add: 1 withOccurrences: 5. b add: 3 withOccurrences: 4. b add: 6. b
and I would like to display it as an histogram with roassal.
Stef _______________________________________________ Moose-dev mailing list Moose-dev@list.inf.unibe.chmailto:Moose-dev@list.inf.unibe.ch https://www.list.inf.unibe.ch/listinfo/moose-dev
________________________________
Ce message et les pièces jointes sont confidentiels et réservés à l'usage exclusif de ses destinataires. Il peut également être protégé par le secret professionnel. Si vous recevez ce message par erreur, merci d'en avertir immédiatement l'expéditeur et de le détruire. L'intégrité du message ne pouvant être assurée sur Internet, la responsabilité de Worldline ne pourra être recherchée quant au contenu de ce message. Bien que les meilleurs efforts soient faits pour maintenir cette transmission exempte de tout virus, l'expéditeur ne donne aucune garantie à cet égard et sa responsabilité ne saurait être recherchée pour tout dommage résultant d'un virus transmis.
This e-mail and the documents attached are confidential and intended solely for the addressee; it may also be privileged. If you receive this e-mail in error, please notify the sender immediately and destroy it. As its integrity cannot be secured on the Internet, the Worldline liability cannot be triggered for the message content. Although the sender endeavours to maintain a computer virus-free network, the sender does not warrant that this transmission is virus-free and will not be liable for any damages resulting from any virus transmitted.
_______________________________________________
Moose-dev mailing list
Moose-dev@list.inf.unibe.chmailto:Moose-dev@list.inf.unibe.ch
https://www.list.inf.unibe.ch/listinfo/moose-dev
_______________________________________________ Moose-dev mailing list Moose-dev@list.inf.unibe.chmailto:Moose-dev@list.inf.unibe.ch https://www.list.inf.unibe.ch/listinfo/moose-dev
-- Guillaume Larcheveque
________________________________
Ce message et les pièces jointes sont confidentiels et réservés à l'usage exclusif de ses destinataires. Il peut également être protégé par le secret professionnel. Si vous recevez ce message par erreur, merci d'en avertir immédiatement l'expéditeur et de le détruire. L'intégrité du message ne pouvant être assurée sur Internet, la responsabilité de Worldline ne pourra être recherchée quant au contenu de ce message. Bien que les meilleurs efforts soient faits pour maintenir cette transmission exempte de tout virus, l'expéditeur ne donne aucune garantie à cet égard et sa responsabilité ne saurait être recherchée pour tout dommage résultant d'un virus transmis.
This e-mail and the documents attached are confidential and intended solely for the addressee; it may also be privileged. If you receive this e-mail in error, please notify the sender immediately and destroy it. As its integrity cannot be secured on the Internet, the Worldline liability cannot be triggered for the message content. Although the sender endeavours to maintain a computer virus-free network, the sender does not warrant that this transmission is virus-free and will not be liable for any damages resulting from any virus transmitted.
2016-02-15 17:29 GMT+01:00 Blondeau Vincent vincent.blondeau@worldline.com :
So we really cannot do that with Roassal inside the image ?
BTW, what we have to load to use your ChartJs ?
execute this:
Metacello new smalltalkhubUser: 'PharoExtras' project: 'ChartJs'; configuration: 'ChartJs'; onWarningLog; version: #development; load
then run seaside server and go to the demo:
http://localhost:8080/ChartJsDemo
Vincent
*De :* moose-dev-bounces@list.inf.unibe.ch [mailto: moose-dev-bounces@list.inf.unibe.ch] *De la part de* Guillaume Larcheveque *Envoyé :* lundi 15 février 2016 17:25
*À :* Moose-related development *Objet :* [Moose-dev] Re: How to display an histogram given a bag
Not sure that you are interested with that but with the implementation of ChartJs i have done for seaside:
stefExample: html
      | b chartData |

      b := Bag new.

      b add: 1 withOccurrences: 5.

      b add: 3 withOccurrences: 4.

      b add: 6.

      chartData := Chart2dData xObjects: (1 to: 6) function: [ :aValue
| b valuesAndCounts at: aValue ifAbsent: 0 ].
      chartData chartType: ChartBar.

      html render: (ChartJsComponent data: chartData)
[image: Images intégrées 1]
2016-02-15 17:11 GMT+01:00 stepharo stepharo@free.fr:
Thanks vincent but how can I get a real histogram? with empty columns for empty values?
Le 15/2/16 16:00, Blondeau Vincent a écrit :
If you want to use the last version:
 b := Bag new.

b add: 1 withOccurrences: 5.

 b add: 3 withOccurrences: 4.

 b add: 6.

 b.


v := RTGrapher new.

ds:=RTData new.

ds interaction popup.

ds points: b valuesAndCounts keys.

ds y:[:c|b valuesAndCounts at: c].

ds barShape color: Color red; width: 15.

v add: ds.

v axisX.

v axisYWithNumberOfTicks: 3.

v build.

v open
But, the abscissa labels are not accurate:
Vincent
*De :* moose-dev-bounces@list.inf.unibe.ch [ mailto:moose-dev-bounces@list.inf.unibe.ch moose-dev-bounces@list.inf.unibe.ch] *De la part de* Brice GOVIN *Envoyé :* lundi 15 février 2016 15:54 *À :* Moose-related development *Objet :* [Moose-dev] Re: How to display an histogram given a bag
You can try something like that:
b := Bag new. b add: 1 withOccurrences: 5. b add: 3withOccurrences: 4. b add: 6. b. v := RTDoubleGraphBuilder new. ds:=RTStackedDataSet new. ds interaction popup. ds points: b valuesAndCounts keys. ds y:[:c|cb valuesAndCounts at: c]. ds barShape color: Color red; width: 15. v add: ds. v axisX. v axisYWithNumberOfTicks: 5. v open*
I'm working with an old version of Roassal (version 761 of the Roassal package) then I don't know if it's working with a more recent version.
Otherwise there is examples in the Grapher Menu of the Roassal examples.
Regards,
Brice Govin PhD student in RMoD research team at INRIA Lille Software Engineer at THALES AIR SYSTEMS Rungis ENSTA-Bretagne ENSI2014 22 Avenue du General Leclerc 92340 BOURG-LA-REINE
De : moose-dev-bounces@list.inf.unibe.ch < moose-dev-bounces@list.inf.unibe.ch> de la part de stepharo < stepharo@free.fr> Envoyé : lundi 15 février 2016 15:22 À : Moose-related development Objet : [Moose-dev] How to display an histogram given a bag
Hi
I have a bag
 b := Bag new.
 b add: 1 withOccurrences: 5.
 b add: 3 withOccurrences: 4.
 b add: 6.
 b
and I would like to display it as an histogram with roassal.
Stef _______________________________________________ Moose-dev mailing list Moose-dev@list.inf.unibe.ch https://www.list.inf.unibe.ch/listinfo/moose-dev
Ce message et les pièces jointes sont confidentiels et réservés à l'usage exclusif de ses destinataires. Il peut également être protégé par le secret professionnel. Si vous recevez ce message par erreur, merci d'en avertir immédiatement l'expéditeur et de le détruire. L'intégrité du message ne pouvant être assurée sur Internet, la responsabilité de Worldline ne pourra être recherchée quant au contenu de ce message. Bien que les meilleurs efforts soient faits pour maintenir cette transmission exempte de tout virus, l'expéditeur ne donne aucune garantie à cet égard et sa responsabilité ne saurait être recherchée pour tout dommage résultant d'un virus transmis.
This e-mail and the documents attached are confidential and intended solely for the addressee; it may also be privileged. If you receive this e-mail in error, please notify the sender immediately and destroy it. As its integrity cannot be secured on the Internet, the Worldline liability cannot be triggered for the message content. Although the sender endeavours to maintain a computer virus-free network, the sender does not warrant that this transmission is virus-free and will not be liable for any damages resulting from any virus transmitted.
Moose-dev mailing list
Moose-dev@list.inf.unibe.ch
https://www.list.inf.unibe.ch/listinfo/moose-dev
Moose-dev mailing list Moose-dev@list.inf.unibe.ch https://www.list.inf.unibe.ch/listinfo/moose-dev
--
*Guillaume Larcheveque*
Ce message et les pièces jointes sont confidentiels et réservés à l'usage exclusif de ses destinataires. Il peut également être protégé par le secret professionnel. Si vous recevez ce message par erreur, merci d'en avertir immédiatement l'expéditeur et de le détruire. L'intégrité du message ne pouvant être assurée sur Internet, la responsabilité de Worldline ne pourra être recherchée quant au contenu de ce message. Bien que les meilleurs efforts soient faits pour maintenir cette transmission exempte de tout virus, l'expéditeur ne donne aucune garantie à cet égard et sa responsabilité ne saurait être recherchée pour tout dommage résultant d'un virus transmis.
This e-mail and the documents attached are confidential and intended solely for the addressee; it may also be privileged. If you receive this e-mail in error, please notify the sender immediately and destroy it. As its integrity cannot be secured on the Internet, the Worldline liability cannot be triggered for the message content. Although the sender endeavours to maintain a computer virus-free network, the sender does not warrant that this transmission is virus-free and will not be liable for any damages resulting from any virus transmitted.
Moose-dev mailing list Moose-dev@list.inf.unibe.ch https://www.list.inf.unibe.ch/listinfo/moose-dev

where is that ChartJs thing?
Stef, there is a histogram message one can send to a collection. On Feb 15, 2016 5:24 PM, "Guillaume Larcheveque" < guillaume.larcheveque@gmail.com> wrote:
Not sure that you are interested with that but with the implementation of ChartJs i have done for seaside:
stefExample: html | b chartData | b := Bag new. b add: 1 withOccurrences: 5. b add: 3 withOccurrences: 4. b add: 6. chartData := Chart2dData xObjects: (1 to: 6) function: [ :aValue | b valuesAndCounts at: aValue ifAbsent: 0 ]. chartData chartType: ChartBar. html render: (ChartJsComponent data: chartData)
[image: Images intégrées 1]
2016-02-15 17:11 GMT+01:00 stepharo stepharo@free.fr:
Thanks vincent but how can I get a real histogram? with empty columns for empty values?
Le 15/2/16 16:00, Blondeau Vincent a écrit :
If you want to use the last version:
 b := Bag new.

b add: 1 withOccurrences: 5.

 b add: 3 withOccurrences: 4.

 b add: 6.

 b.


v := RTGrapher new.

ds:=RTData new.

ds interaction popup.

ds points: b valuesAndCounts keys.

ds y:[:c|b valuesAndCounts at: c].

ds barShape color: Color red; width: 15.

v add: ds.

v axisX.

v axisYWithNumberOfTicks: 3.

v build.

v open
But, the abscissa labels are not accurate:
Vincent
*De :* moose-dev-bounces@list.inf.unibe.ch [ mailto:moose-dev-bounces@list.inf.unibe.ch moose-dev-bounces@list.inf.unibe.ch] *De la part de* Brice GOVIN *Envoyé :* lundi 15 février 2016 15:54 *À :* Moose-related development *Objet :* [Moose-dev] Re: How to display an histogram given a bag
You can try something like that:
b := Bag new. b add: 1 withOccurrences: 5. b add: 3withOccurrences: 4. b add: 6. b. v := RTDoubleGraphBuilder new. ds:=RTStackedDataSet new. ds interaction popup. ds points: b valuesAndCounts keys. ds y:[:c|cb valuesAndCounts at: c]. ds barShape color: Color red; width: 15. v add: ds. v axisX. v axisYWithNumberOfTicks: 5. v open*
I'm working with an old version of Roassal (version 761 of the Roassal package) then I don't know if it's working with a more recent version.
Otherwise there is examples in the Grapher Menu of the Roassal examples.
Regards,
Brice Govin PhD student in RMoD research team at INRIA Lille Software Engineer at THALES AIR SYSTEMS Rungis ENSTA-Bretagne ENSI2014 22 Avenue du General Leclerc 92340 BOURG-LA-REINE
De : moose-dev-bounces@list.inf.unibe.ch < moose-dev-bounces@list.inf.unibe.ch> de la part de stepharo < stepharo@free.fr> Envoyé : lundi 15 février 2016 15:22 À : Moose-related development Objet : [Moose-dev] How to display an histogram given a bag
Hi
I have a bag
 b := Bag new.
 b add: 1 withOccurrences: 5.
 b add: 3 withOccurrences: 4.
 b add: 6.
 b
and I would like to display it as an histogram with roassal.
Stef _______________________________________________ Moose-dev mailing list Moose-dev@list.inf.unibe.ch https://www.list.inf.unibe.ch/listinfo/moose-dev
Ce message et les pièces jointes sont confidentiels et réservés à l'usage exclusif de ses destinataires. Il peut également être protégé par le secret professionnel. Si vous recevez ce message par erreur, merci d'en avertir immédiatement l'expéditeur et de le détruire. L'intégrité du message ne pouvant être assurée sur Internet, la responsabilité de Worldline ne pourra être recherchée quant au contenu de ce message. Bien que les meilleurs efforts soient faits pour maintenir cette transmission exempte de tout virus, l'expéditeur ne donne aucune garantie à cet égard et sa responsabilité ne saurait être recherchée pour tout dommage résultant d'un virus transmis.
This e-mail and the documents attached are confidential and intended solely for the addressee; it may also be privileged. If you receive this e-mail in error, please notify the sender immediately and destroy it. As its integrity cannot be secured on the Internet, the Worldline liability cannot be triggered for the message content. Although the sender endeavours to maintain a computer virus-free network, the sender does not warrant that this transmission is virus-free and will not be liable for any damages resulting from any virus transmitted.
Moose-dev mailing listMoose-dev@list.inf.unibe.chhttps://www.list.inf.unibe.ch/listinfo/moose-dev
Moose-dev mailing list Moose-dev@list.inf.unibe.ch https://www.list.inf.unibe.ch/listinfo/moose-dev
-- *Guillaume Larcheveque*
Moose-dev mailing list Moose-dev@list.inf.unibe.ch https://www.list.inf.unibe.ch/listinfo/moose-dev
Tx
now how can I see that there is no value for 2 and 5?
Stef
Le 15/2/16 15:54, Brice GOVIN a écrit :
You can try something like that:
/ b := Bag new. b add: 1 withOccurrences: 5. b add: 3 withOccurrences: 4. b add: 6. b.
v := RTDoubleGraphBuilder new. ds:=RTStackedDataSet new. ds interaction popup. ds points: b valuesAndCounts keys. ds y:[:c|cb valuesAndCounts at: c]. ds barShape color: Color red; width: 15. v add: ds. v axisX. v axisYWithNumberOfTicks: 5. v open/
I'm working with an old version of Roassal (version 761 of the Roassal package) then I don't know if it's working with a more recent version.
Otherwise there is examples in the Grapher Menu of the Roassal examples.
Regards,
Brice Govin PhD student in RMoD research team at INRIA Lille Software Engineer at THALES AIR SYSTEMS Rungis ENSTA-Bretagne ENSI2014 22 Avenue du General Leclerc 92340 BOURG-LA-REINE
De : moose-dev-bounces@list.inf.unibe.ch moose-dev-bounces@list.inf.unibe.ch de la part de stepharo stepharo@free.fr Envoyé : lundi 15 février 2016 15:22 À : Moose-related development Objet : [Moose-dev] How to display an histogram given a bag
Hi
I have a bag
 b := Bag new.
 b add: 1 withOccurrences: 5.
 b add: 3 withOccurrences: 4.
 b add: 6.
 b
and I would like to display it as an histogram with roassal.
Stef _______________________________________________ Moose-dev mailing list Moose-dev@list.inf.unibe.ch https://www.list.inf.unibe.ch/listinfo/moose-dev
Moose-dev mailing list Moose-dev@list.inf.unibe.ch https://www.list.inf.unibe.ch/listinfo/moose-dev

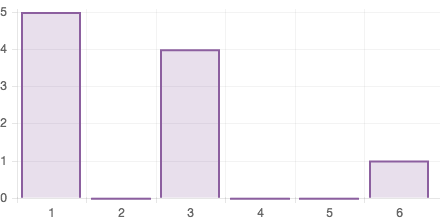
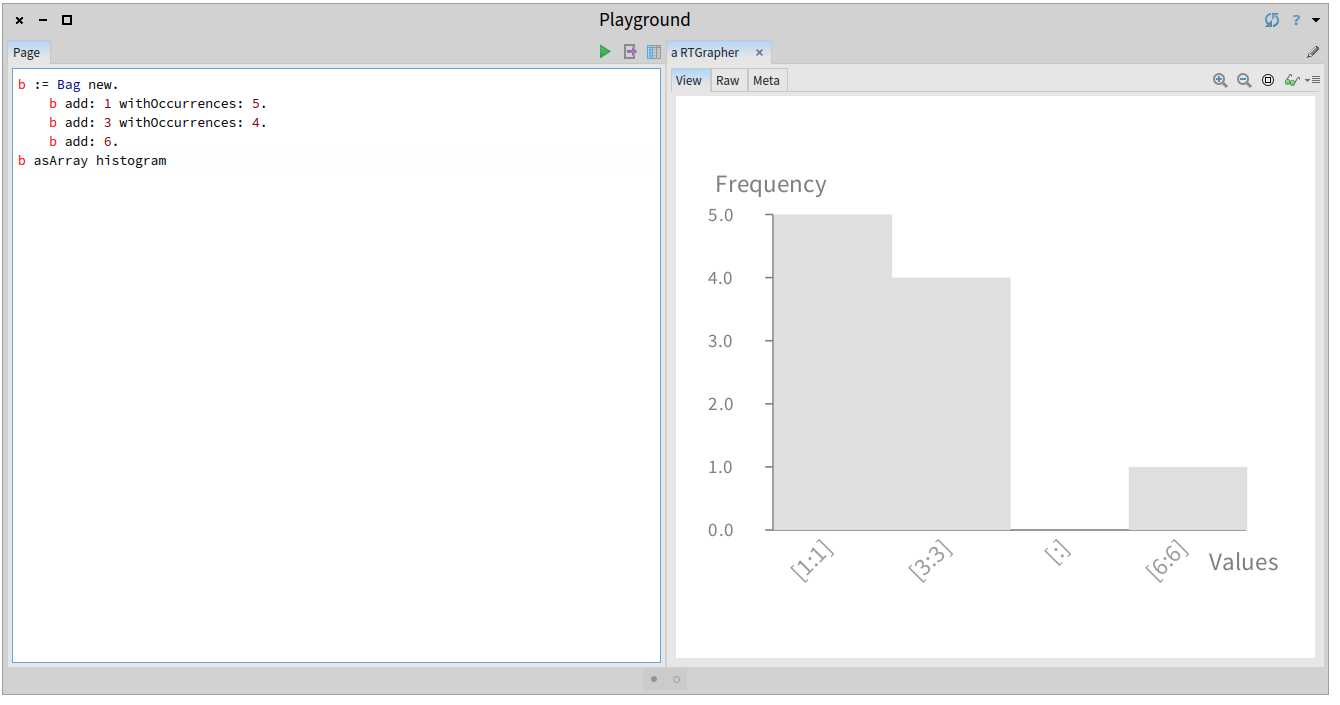
In a playground, I try:
b := Bag new. b add: 1 withOccurrences: 5. b add: 3 withOccurrences: 4. b add: 6. b asArray histogram
But the result is buggy apparently ...
On Mon, Feb 15, 2016 at 3:22 PM, stepharo stepharo@free.fr wrote:
Hi
I have a bag
b := Bag new. b add: 1 withOccurrences: 5. b add: 3 withOccurrences: 4. b add: 6. band I would like to display it as an histogram with roassal.
Stef _______________________________________________ Moose-dev mailing list Moose-dev@list.inf.unibe.ch https://www.list.inf.unibe.ch/listinfo/moose-dev

The Roassal #histogram should just work in a cool way.
Make easy things easy, you will get great response.
On 15 Feb 2016, at 17:34, Serge Stinckwich serge.stinckwich@gmail.com wrote:
In a playground, I try:
b := Bag new. b add: 1 withOccurrences: 5. b add: 3 withOccurrences: 4. b add: 6. b asArray histogram
But the result is buggy apparently ...
On Mon, Feb 15, 2016 at 3:22 PM, stepharo stepharo@free.fr wrote:
Hi
I have a bag
b := Bag new. b add: 1 withOccurrences: 5. b add: 3 withOccurrences: 4. b add: 6. b
and I would like to display it as an histogram with roassal.
Stef _______________________________________________ Moose-dev mailing list Moose-dev@list.inf.unibe.ch https://www.list.inf.unibe.ch/listinfo/moose-dev
-- Serge Stinckwich UCBN & UMI UMMISCO 209 (IRD/UPMC) Every DSL ends up being Smalltalk http://www.doesnotunderstand.org/ <Screen Shot 2016-02-15 at 17.33.44.png>_______________________________________________ Moose-dev mailing list Moose-dev@list.inf.unibe.ch https://www.list.inf.unibe.ch/listinfo/moose-dev

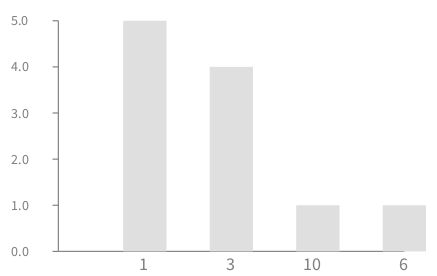
There are numerous ways to draw an histogram.
Here some examples: b := Bag new. b add: 1 withOccurrences: 5. b add: 3 withOccurrences: 4. b add: 6. b add: 10. v := RTGrapher new. ds := RTData new. ds interaction popup. ds points: b valuesAndCounts keys. ds y: [:c|b valuesAndCounts at: c] . ds barChartWithBarTitle: #yourself rotation: 0. v add: ds. v axisX noTick. v
b := Bag new. b add: 1 withOccurrences: 5. b add: 3 withOccurrences: 4. b add: 6. b add: 10. v := RTGrapher new. ds := RTData new. ds interaction popup. ds points: b valuesAndCounts keys. ds y: [ :c|b valuesAndCounts at: c] . ds x: #yourself. ds barShape. v add: ds. v axisX numberOfLabels: 10; noDecimal. v axisY noDecimal. v
Indeed, #histogram is buggy.
Alexandre
On Feb 15, 2016, at 6:37 PM, Sven Van Caekenberghe sven@stfx.eu wrote:
The Roassal #histogram should just work in a cool way.
Make easy things easy, you will get great response.
On 15 Feb 2016, at 17:34, Serge Stinckwich serge.stinckwich@gmail.com wrote:
In a playground, I try:
b := Bag new. b add: 1 withOccurrences: 5. b add: 3 withOccurrences: 4. b add: 6. b asArray histogram
But the result is buggy apparently ...
On Mon, Feb 15, 2016 at 3:22 PM, stepharo stepharo@free.fr wrote:
Hi
I have a bag
b := Bag new. b add: 1 withOccurrences: 5. b add: 3 withOccurrences: 4. b add: 6. b
and I would like to display it as an histogram with roassal.
Stef _______________________________________________ Moose-dev mailing list Moose-dev@list.inf.unibe.ch https://www.list.inf.unibe.ch/listinfo/moose-dev
-- Serge Stinckwich UCBN & UMI UMMISCO 209 (IRD/UPMC) Every DSL ends up being Smalltalk http://www.doesnotunderstand.org/ <Screen Shot 2016-02-15 at 17.33.44.png>_______________________________________________ Moose-dev mailing list Moose-dev@list.inf.unibe.ch https://www.list.inf.unibe.ch/listinfo/moose-dev
Moose-dev mailing list Moose-dev@list.inf.unibe.ch https://www.list.inf.unibe.ch/listinfo/moose-dev
-
 Alexandre Bergel
 -
 Blondeau Vincent
 -
 Brice GOVIN
 -
 Guillaume Larcheveque
 -
 philippe.back@highoctane.be
 -
 Serge Stinckwich
 -
 stepharo
 -
 Sven Van Caekenberghe