
Hi,
We are about to integrate in Pharo a new member of the Glamorous Toolkit: the GTDebugger. As this is a significant change that might affect your workflow, here is some background information to help you deal with the change.
First, you should know that the change is not irreversible and it is easily possible to disabled the new debugger through a setting. However, please do take the time to provide us feedback if something does not work out for you. We want to know what can be improved and we try to react as fast as we can.
A practical change comes from the fact that the variables are manipulated through a GTInspector, which makes it cheaper to maintain in the longer run.
While the first thing that will capture the attention is the default generic interface, the real power comes from the moldable nature of the debugger. Like all other GT tools, GTDebugger is also moldable by design. This means that we can construct custom debuggers for specific libraries at small costs (often measured in a couple of hundred lines of code).
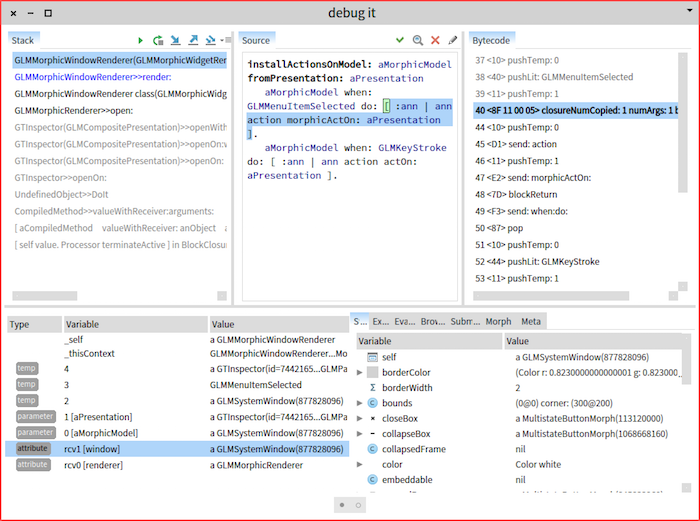
For example, the core configuration includes also the SUnit and the bytecode debugger. These are around 150 lines of code. Here is how the bytecode debugger looks like:
You can find more information in an introductory overview blog post that also includes some links for further reading: http://www.humane-assessment.com/blog/gtdebugger-in-pharo/
Please let us know what you think.
Cheers, Doru
-- www.tudorgirba.com www.feenk.com
"What is more important: To be happy, or to make happy?"

does the GTDebugger respect the pharo themes support or is it like GTSpotter ?
On Fri, Jan 8, 2016 at 1:08 PM Tudor Girba tudor@tudorgirba.com wrote:
Hi,
We are about to integrate in Pharo a new member of the Glamorous Toolkit: the GTDebugger. As this is a significant change that might affect your workflow, here is some background information to help you deal with the change.
First, you should know that the change is not irreversible and it is easily possible to disabled the new debugger through a setting. However, please do take the time to provide us feedback if something does not work out for you. We want to know what can be improved and we try to react as fast as we can.
A practical change comes from the fact that the variables are manipulated through a GTInspector, which makes it cheaper to maintain in the longer run.
While the first thing that will capture the attention is the default generic interface, the real power comes from the moldable nature of the debugger. Like all other GT tools, GTDebugger is also moldable by design. This means that we can construct custom debuggers for specific libraries at small costs (often measured in a couple of hundred lines of code).
For example, the core configuration includes also the SUnit and the bytecode debugger. These are around 150 lines of code. Here is how the bytecode debugger looks like:
You can find more information in an introductory overview blog post that also includes some links for further reading:
http://www.humane-assessment.com/blog/gtdebugger-in-pharo/
Please let us know what you think.
Cheers, Doru
-- www.tudorgirba.com www.feenk.com
"What is more important: To be happy, or to make happy?"
Moose-dev mailing list Moose-dev@list.inf.unibe.ch https://www.list.inf.unibe.ch/listinfo/moose-dev

On Fri, Jan 8, 2016 at 2:09 PM, Dimitris Chloupis kilon.alios@gmail.com wrote:
does the GTDebugger respect the pharo themes support or is it like GTSpotter ?
It behaves just as GTInspector regrading the theme. Just if you are using a custom theme and want to have the coloring of the stack enabled you need to provide the appropriate colors in your theme (styleContext:from:)
Cheers, Andrei
On Fri, Jan 8, 2016 at 1:08 PM Tudor Girba tudor@tudorgirba.com wrote:
Hi,
We are about to integrate in Pharo a new member of the Glamorous Toolkit: the GTDebugger. As this is a significant change that might affect your workflow, here is some background information to help you deal with the change.
First, you should know that the change is not irreversible and it is easily possible to disabled the new debugger through a setting. However, please do take the time to provide us feedback if something does not work out for you. We want to know what can be improved and we try to react as fast as we can.
A practical change comes from the fact that the variables are manipulated through a GTInspector, which makes it cheaper to maintain in the longer run.
While the first thing that will capture the attention is the default generic interface, the real power comes from the moldable nature of the debugger. Like all other GT tools, GTDebugger is also moldable by design. This means that we can construct custom debuggers for specific libraries at small costs (often measured in a couple of hundred lines of code).
For example, the core configuration includes also the SUnit and the bytecode debugger. These are around 150 lines of code. Here is how the bytecode debugger looks like:
You can find more information in an introductory overview blog post that also includes some links for further reading:
http://www.humane-assessment.com/blog/gtdebugger-in-pharo/
Please let us know what you think.
Cheers, Doru
-- www.tudorgirba.com www.feenk.com
"What is more important: To be happy, or to make happy?"
Moose-dev mailing list Moose-dev@list.inf.unibe.ch https://www.list.inf.unibe.ch/listinfo/moose-dev
Moose-dev mailing list Moose-dev@list.inf.unibe.ch https://www.list.inf.unibe.ch/listinfo/moose-dev
is there any documentation about this ? or i just look at the relevant classes ?
On Fri, Jan 8, 2016 at 3:20 PM Andrei Chis chisvasileandrei@gmail.com wrote:
On Fri, Jan 8, 2016 at 2:09 PM, Dimitris Chloupis kilon.alios@gmail.com wrote:
does the GTDebugger respect the pharo themes support or is it like GTSpotter ?
It behaves just as GTInspector regrading the theme. Just if you are using a custom theme and want to have the coloring of the stack enabled you need to provide the appropriate colors in your theme (styleContext:from:)
Cheers, Andrei
On Fri, Jan 8, 2016 at 1:08 PM Tudor Girba tudor@tudorgirba.com wrote:
Hi,
We are about to integrate in Pharo a new member of the Glamorous Toolkit: the GTDebugger. As this is a significant change that might affect your workflow, here is some background information to help you deal with the change.
First, you should know that the change is not irreversible and it is easily possible to disabled the new debugger through a setting. However, please do take the time to provide us feedback if something does not work out for you. We want to know what can be improved and we try to react as fast as we can.
A practical change comes from the fact that the variables are manipulated through a GTInspector, which makes it cheaper to maintain in the longer run.
While the first thing that will capture the attention is the default generic interface, the real power comes from the moldable nature of the debugger. Like all other GT tools, GTDebugger is also moldable by design. This means that we can construct custom debuggers for specific libraries at small costs (often measured in a couple of hundred lines of code).
For example, the core configuration includes also the SUnit and the bytecode debugger. These are around 150 lines of code. Here is how the bytecode debugger looks like:
You can find more information in an introductory overview blog post that also includes some links for further reading:
http://www.humane-assessment.com/blog/gtdebugger-in-pharo/
Please let us know what you think.
Cheers, Doru
-- www.tudorgirba.com www.feenk.com
"What is more important: To be happy, or to make happy?"
Moose-dev mailing list Moose-dev@list.inf.unibe.ch https://www.list.inf.unibe.ch/listinfo/moose-dev
Moose-dev mailing list Moose-dev@list.inf.unibe.ch https://www.list.inf.unibe.ch/listinfo/moose-dev
Moose-dev mailing list Moose-dev@list.inf.unibe.ch https://www.list.inf.unibe.ch/listinfo/moose-dev
On Fri, Jan 8, 2016 at 2:23 PM, Dimitris Chloupis kilon.alios@gmail.com wrote:
is there any documentation about this ? or i just look at the relevant classes ?
Not really. Now you'll need to look in UITheme>>styleContext:from:, but I'll refactor that method shortly.
On Fri, Jan 8, 2016 at 3:20 PM Andrei Chis chisvasileandrei@gmail.com wrote:
On Fri, Jan 8, 2016 at 2:09 PM, Dimitris Chloupis kilon.alios@gmail.com wrote:
does the GTDebugger respect the pharo themes support or is it like GTSpotter ?
It behaves just as GTInspector regrading the theme. Just if you are using a custom theme and want to have the coloring of the stack enabled you need to provide the appropriate colors in your theme (styleContext:from:)
Cheers, Andrei
On Fri, Jan 8, 2016 at 1:08 PM Tudor Girba tudor@tudorgirba.com wrote:
Hi,
We are about to integrate in Pharo a new member of the Glamorous Toolkit: the GTDebugger. As this is a significant change that might affect your workflow, here is some background information to help you deal with the change.
First, you should know that the change is not irreversible and it is easily possible to disabled the new debugger through a setting. However, please do take the time to provide us feedback if something does not work out for you. We want to know what can be improved and we try to react as fast as we can.
A practical change comes from the fact that the variables are manipulated through a GTInspector, which makes it cheaper to maintain in the longer run.
While the first thing that will capture the attention is the default generic interface, the real power comes from the moldable nature of the debugger. Like all other GT tools, GTDebugger is also moldable by design. This means that we can construct custom debuggers for specific libraries at small costs (often measured in a couple of hundred lines of code).
For example, the core configuration includes also the SUnit and the bytecode debugger. These are around 150 lines of code. Here is how the bytecode debugger looks like:
You can find more information in an introductory overview blog post that also includes some links for further reading:
http://www.humane-assessment.com/blog/gtdebugger-in-pharo/
Please let us know what you think.
Cheers, Doru
-- www.tudorgirba.com www.feenk.com
"What is more important: To be happy, or to make happy?"
Moose-dev mailing list Moose-dev@list.inf.unibe.ch https://www.list.inf.unibe.ch/listinfo/moose-dev
Moose-dev mailing list Moose-dev@list.inf.unibe.ch https://www.list.inf.unibe.ch/listinfo/moose-dev
Moose-dev mailing list Moose-dev@list.inf.unibe.ch https://www.list.inf.unibe.ch/listinfo/moose-dev
thank you :)
On Fri, Jan 8, 2016 at 3:35 PM Andrei Chis chisvasileandrei@gmail.com wrote:
On Fri, Jan 8, 2016 at 2:23 PM, Dimitris Chloupis kilon.alios@gmail.com wrote:
is there any documentation about this ? or i just look at the relevant classes ?
Not really. Now you'll need to look in UITheme>>styleContext:from:, but I'll refactor that method shortly.
On Fri, Jan 8, 2016 at 3:20 PM Andrei Chis chisvasileandrei@gmail.com wrote:
On Fri, Jan 8, 2016 at 2:09 PM, Dimitris Chloupis <kilon.alios@gmail.com
wrote:
does the GTDebugger respect the pharo themes support or is it like GTSpotter ?
It behaves just as GTInspector regrading the theme. Just if you are using a custom theme and want to have the coloring of the stack enabled you need to provide the appropriate colors in your theme (styleContext:from:)
Cheers, Andrei
On Fri, Jan 8, 2016 at 1:08 PM Tudor Girba tudor@tudorgirba.com wrote:
Hi,
We are about to integrate in Pharo a new member of the Glamorous Toolkit: the GTDebugger. As this is a significant change that might affect your workflow, here is some background information to help you deal with the change.
First, you should know that the change is not irreversible and it is easily possible to disabled the new debugger through a setting. However, please do take the time to provide us feedback if something does not work out for you. We want to know what can be improved and we try to react as fast as we can.
A practical change comes from the fact that the variables are manipulated through a GTInspector, which makes it cheaper to maintain in the longer run.
While the first thing that will capture the attention is the default generic interface, the real power comes from the moldable nature of the debugger. Like all other GT tools, GTDebugger is also moldable by design. This means that we can construct custom debuggers for specific libraries at small costs (often measured in a couple of hundred lines of code).
For example, the core configuration includes also the SUnit and the bytecode debugger. These are around 150 lines of code. Here is how the bytecode debugger looks like:
You can find more information in an introductory overview blog post that also includes some links for further reading:
http://www.humane-assessment.com/blog/gtdebugger-in-pharo/
Please let us know what you think.
Cheers, Doru
-- www.tudorgirba.com www.feenk.com
"What is more important: To be happy, or to make happy?"
Moose-dev mailing list Moose-dev@list.inf.unibe.ch https://www.list.inf.unibe.ch/listinfo/moose-dev
Moose-dev mailing list Moose-dev@list.inf.unibe.ch https://www.list.inf.unibe.ch/listinfo/moose-dev
Moose-dev mailing list Moose-dev@list.inf.unibe.ch https://www.list.inf.unibe.ch/listinfo/moose-dev
Moose-dev mailing list Moose-dev@list.inf.unibe.ch https://www.list.inf.unibe.ch/listinfo/moose-dev

This is an excellent news! I have been waiting for that for long! go go go!
Alexandre
Hello everyone,
As expected, there was some feedback. Here is a summary:
1. The layout should mirror the classic debugger - The previous layout was chosen to show more of the stack and to make use of the screen real estate. - But, as that is not an essential component of GTDebugger, the current implementation of the generic stack debugger looks like this now:
2. it would be interesting if the buttons would have text - This is something we need to work on
3. Why is there bytecode shown? - There is none by default :). This only appears when the developer explicitly chooses the Bytecode debugger
4. why is there a _thisContext _stackTop? - Because this is what the SpecDebugger offers as well :). - But, we removed them for now from the list. - There would be a possibility to add them to the context menu of the stack or to add them to bottom of the list
5. why is there a Type column in the inspector - Because we want to know what kind of variable we are dealing with (parameter, instvar, temp). This is not explicit in other debuggers. - Furthermore, you can filter the variables by clicking on the type tag. This can be particularly useful when we deal with large states.
Please let me know if I missed anything. Of these only point 2 requires work.
Cheers, Doru
On Jan 8, 2016, at 1:07 PM, Tudor Girba tudor@tudorgirba.com wrote:
Hi,
We are about to integrate in Pharo a new member of the Glamorous Toolkit: the GTDebugger. As this is a significant change that might affect your workflow, here is some background information to help you deal with the change.
First, you should know that the change is not irreversible and it is easily possible to disabled the new debugger through a setting. However, please do take the time to provide us feedback if something does not work out for you. We want to know what can be improved and we try to react as fast as we can.
A practical change comes from the fact that the variables are manipulated through a GTInspector, which makes it cheaper to maintain in the longer run.
While the first thing that will capture the attention is the default generic interface, the real power comes from the moldable nature of the debugger. Like all other GT tools, GTDebugger is also moldable by design. This means that we can construct custom debuggers for specific libraries at small costs (often measured in a couple of hundred lines of code).
For example, the core configuration includes also the SUnit and the bytecode debugger. These are around 150 lines of code. Here is how the bytecode debugger looks like:
<bytecode.png>
You can find more information in an introductory overview blog post that also includes some links for further reading: http://www.humane-assessment.com/blog/gtdebugger-in-pharo/
Please let us know what you think.
Cheers, Doru
-- www.tudorgirba.com www.feenk.com
"What is more important: To be happy, or to make happy?"
-- www.tudorgirba.com www.feenk.com
"It's not how it is, it is how we see it."

Le 08/01/2016 12:07, Tudor Girba a écrit :
Hi,
We are about to integrate in Pharo a new member of the Glamorous Toolkit: the GTDebugger. As this is a significant change that might affect your workflow, here is some background information to help you deal with the change.
First, you should know that the change is not irreversible and it is easily possible to disabled the new debugger through a setting. However, please do take the time to provide us feedback if something does not work out for you. We want to know what can be improved and we try to react as fast as we can.
A practical change comes from the fact that the variables are manipulated through a GTInspector, which makes it cheaper to maintain in the longer run.
While the first thing that will capture the attention is the default generic interface, the real power comes from the moldable nature of the debugger. Like all other GT tools, GTDebugger is also moldable by design. This means that we can construct custom debuggers for specific libraries at small costs (often measured in a couple of hundred lines of code).
For example, the core configuration includes also the SUnit and the bytecode debugger. These are around 150 lines of code. Here is how the bytecode debugger looks like:
You can find more information in an introductory overview blog post that also includes some links for further reading: http://www.humane-assessment.com/blog/gtdebugger-in-pharo/
Please let us know what you think.
Cheers, Doru
-- www.tudorgirba.com http://www.tudorgirba.com www.feenk.com
"What is more important: To be happy, or to make happy?"
Moose-dev mailing list Moose-dev@list.inf.unibe.ch https://www.list.inf.unibe.ch/listinfo/moose-dev
Hi,
An other thing that came in my mind is that, for now, GTDebugger lack documentation. Some classes have no documentation and the class with a comment only have 1 line and don't follow the template.
It's good that people takes time to add documentation but if the new classes that Pharo include does not have a proper documentation (class doc + comments in complex methods) we will never be able to have a version of Pharo with a good documentation.
I think that we should not integrate new classes if they don't have a class comment that follow the template.

On 10 Jan 2016, at 21:14, Ferlicot D. Cyril cyril.ferlicot@gmail.com wrote:
Le 08/01/2016 12:07, Tudor Girba a écrit :
Hi,
We are about to integrate in Pharo a new member of the Glamorous Toolkit: the GTDebugger. As this is a significant change that might affect your workflow, here is some background information to help you deal with the change.
First, you should know that the change is not irreversible and it is easily possible to disabled the new debugger through a setting. However, please do take the time to provide us feedback if something does not work out for you. We want to know what can be improved and we try to react as fast as we can.
A practical change comes from the fact that the variables are manipulated through a GTInspector, which makes it cheaper to maintain in the longer run.
While the first thing that will capture the attention is the default generic interface, the real power comes from the moldable nature of the debugger. Like all other GT tools, GTDebugger is also moldable by design. This means that we can construct custom debuggers for specific libraries at small costs (often measured in a couple of hundred lines of code).
For example, the core configuration includes also the SUnit and the bytecode debugger. These are around 150 lines of code. Here is how the bytecode debugger looks like:
You can find more information in an introductory overview blog post that also includes some links for further reading: http://www.humane-assessment.com/blog/gtdebugger-in-pharo/
Please let us know what you think.
Cheers, Doru
-- www.tudorgirba.com http://www.tudorgirba.com www.feenk.com
"What is more important: To be happy, or to make happy?"
Moose-dev mailing list Moose-dev@list.inf.unibe.ch https://www.list.inf.unibe.ch/listinfo/moose-dev
Hi,
An other thing that came in my mind is that, for now, GTDebugger lack documentation. Some classes have no documentation and the class with a comment only have 1 line and don't follow the template.
It's good that people takes time to add documentation but if the new classes that Pharo include does not have a proper documentation (class doc + comments in complex methods) we will never be able to have a version of Pharo with a good documentation.
I think that we should not integrate new classes if they don't have a class comment that follow the template.
+100
I can understand that when prototype, hacking, being generally productive inside Pharo, you don't write comments at first. But once you go public, after some iterations, and especially if you want to be integrated into Pharo itself, there is no excuse. We need proper class comments, and comments for the main non-trivial public methods.
Sven
-- Cyril Ferlicot
165 Avenue Bretagne Lille 59000 France
Moose-dev mailing list Moose-dev@list.inf.unibe.ch https://www.list.inf.unibe.ch/listinfo/moose-dev
I cant understand it not having comments in the first place because i forget so easily , especially when the code grow larger. But yeah class comments would be the best feature that pharo can ever have. It would make coding 1000 times easier.
On Sun, Jan 10, 2016 at 10:25 PM Sven Van Caekenberghe sven@stfx.eu wrote:
On 10 Jan 2016, at 21:14, Ferlicot D. Cyril cyril.ferlicot@gmail.com
wrote:
Le 08/01/2016 12:07, Tudor Girba a écrit :
Hi,
We are about to integrate in Pharo a new member of the Glamorous Toolkit: the GTDebugger. As this is a significant change that might affect your workflow, here is some background information to help you deal with the change.
First, you should know that the change is not irreversible and it is easily possible to disabled the new debugger through a setting. However, please do take the time to provide us feedback if something does not work out for you. We want to know what can be improved and we try to react as fast as we can.
A practical change comes from the fact that the variables are manipulated through a GTInspector, which makes it cheaper to maintain in the longer run.
While the first thing that will capture the attention is the default generic interface, the real power comes from the moldable nature of the debugger. Like all other GT tools, GTDebugger is also moldable by design. This means that we can construct custom debuggers for specific libraries at small costs (often measured in a couple of hundred lines of code).
For example, the core configuration includes also the SUnit and the bytecode debugger. These are around 150 lines of code. Here is how the bytecode debugger looks like:
You can find more information in an introductory overview blog post that also includes some links for further reading: http://www.humane-assessment.com/blog/gtdebugger-in-pharo/
Please let us know what you think.
Cheers, Doru
-- www.tudorgirba.com http://www.tudorgirba.com www.feenk.com
"What is more important: To be happy, or to make happy?"
Moose-dev mailing list Moose-dev@list.inf.unibe.ch https://www.list.inf.unibe.ch/listinfo/moose-dev
Hi,
An other thing that came in my mind is that, for now, GTDebugger lack documentation. Some classes have no documentation and the class with a comment only have 1 line and don't follow the template.
It's good that people takes time to add documentation but if the new classes that Pharo include does not have a proper documentation (class doc + comments in complex methods) we will never be able to have a version of Pharo with a good documentation.
I think that we should not integrate new classes if they don't have a class comment that follow the template.
+100
I can understand that when prototype, hacking, being generally productive inside Pharo, you don't write comments at first. But once you go public, after some iterations, and especially if you want to be integrated into Pharo itself, there is no excuse. We need proper class comments, and comments for the main non-trivial public methods.
Sven
-- Cyril Ferlicot
165 Avenue Bretagne Lille 59000 France
Moose-dev mailing list Moose-dev@list.inf.unibe.ch https://www.list.inf.unibe.ch/listinfo/moose-dev
Moose-dev mailing list Moose-dev@list.inf.unibe.ch https://www.list.inf.unibe.ch/listinfo/moose-dev
but then I remember once trying to find a tutorial about opengl 3, could not find a thing, then i found one and I wished I never found it. Sometime not documenting thing can be good for your emotional state , ignorance is a bliss :D
On Sun, Jan 10, 2016 at 10:33 PM Dimitris Chloupis kilon.alios@gmail.com wrote:
I cant understand it not having comments in the first place because i forget so easily , especially when the code grow larger. But yeah class comments would be the best feature that pharo can ever have. It would make coding 1000 times easier.
On Sun, Jan 10, 2016 at 10:25 PM Sven Van Caekenberghe sven@stfx.eu wrote:
On 10 Jan 2016, at 21:14, Ferlicot D. Cyril cyril.ferlicot@gmail.com
wrote:
Le 08/01/2016 12:07, Tudor Girba a écrit :
Hi,
We are about to integrate in Pharo a new member of the Glamorous Toolkit: the GTDebugger. As this is a significant change that might affect your workflow, here is some background information to help you deal with the change.
First, you should know that the change is not irreversible and it is easily possible to disabled the new debugger through a setting.
However,
please do take the time to provide us feedback if something does not work out for you. We want to know what can be improved and we try
to
react as fast as we can.
A practical change comes from the fact that the variables are manipulated through a GTInspector, which makes it cheaper to maintain
in
the longer run.
While the first thing that will capture the attention is the default generic interface, the real power comes from the moldable nature of the debugger. Like all other GT tools, GTDebugger is also moldable by design. This means that we can construct custom debuggers for specific libraries at small costs (often measured in a couple of hundred lines
of
code).
For example, the core configuration includes also the SUnit and the bytecode debugger. These are around 150 lines of code. Here is how the bytecode debugger looks like:
You can find more information in an introductory overview blog post
that
also includes some links for further reading: http://www.humane-assessment.com/blog/gtdebugger-in-pharo/
Please let us know what you think.
Cheers, Doru
-- www.tudorgirba.com http://www.tudorgirba.com www.feenk.com
"What is more important: To be happy, or to make happy?"
Moose-dev mailing list Moose-dev@list.inf.unibe.ch https://www.list.inf.unibe.ch/listinfo/moose-dev
Hi,
An other thing that came in my mind is that, for now, GTDebugger lack documentation. Some classes have no documentation and the class with a comment only have 1 line and don't follow the template.
It's good that people takes time to add documentation but if the new classes that Pharo include does not have a proper documentation (class doc + comments in complex methods) we will never be able to have a version of Pharo with a good documentation.
I think that we should not integrate new classes if they don't have a class comment that follow the template.
+100
I can understand that when prototype, hacking, being generally productive inside Pharo, you don't write comments at first. But once you go public, after some iterations, and especially if you want to be integrated into Pharo itself, there is no excuse. We need proper class comments, and comments for the main non-trivial public methods.
Sven
-- Cyril Ferlicot
165 Avenue Bretagne Lille 59000 France
Moose-dev mailing list Moose-dev@list.inf.unibe.ch https://www.list.inf.unibe.ch/listinfo/moose-dev
Moose-dev mailing list Moose-dev@list.inf.unibe.ch https://www.list.inf.unibe.ch/listinfo/moose-dev
I see the motivation, but things should go incrementally. If code should be highly documented, with a high test coverage, friendly to API migration then well.. not much happens…
Cheers, Alexandre
On Jan 10, 2016, at 5:24 PM, Sven Van Caekenberghe sven@stfx.eu wrote:
I think that we should not integrate new classes if they don't have a class comment that follow the template.
+100
I can understand that when prototype, hacking, being generally productive inside Pharo, you don't write comments at first. But once you go public, after some iterations, and especially if you want to be integrated into Pharo itself, there is no excuse. We need proper class comments, and comments for the main non-trivial public methods.
How much time it takes to write a short comment for a class ? One minute ? Two ?
Why not help people help you ? Is it not better to make it easier to cooperate ?
On Mon, 11 Jan 2016 at 00:31, Alexandre Bergel alexandre.bergel@me.com wrote:
I see the motivation, but things should go incrementally. If code should be highly documented, with a high test coverage, friendly to API migration then well.. not much happens…
Cheers, Alexandre
On Jan 10, 2016, at 5:24 PM, Sven Van Caekenberghe sven@stfx.eu wrote:
I think that we should not integrate new classes if they don't have a class comment that follow the template.
+100
I can understand that when prototype, hacking, being generally
productive inside Pharo, you don't write comments at first. But once you go public, after some iterations, and especially if you want to be integrated into Pharo itself, there is no excuse. We need proper class comments, and comments for the main non-trivial public methods.
-- _,.;:~^~:;._,.;:~^~:;._,.;:~^~:;._,.;:~^~:;._,.;: Alexandre Bergel http://www.bergel.eu ^~:;._,.;:~^~:;._,.;:~^~:;._,.;:~^~:;._,.;:~^~:;.
Moose-dev mailing list Moose-dev@list.inf.unibe.ch https://www.list.inf.unibe.ch/listinfo/moose-dev
We did write more comments in the last version, but we would indeed benefit from more details now that things should be more stable. If anyone is interested to contribute, it would be of great help.
Doru
On Jan 11, 2016, at 12:48 AM, Dimitris Chloupis kilon.alios@gmail.com wrote:
How much time it takes to write a short comment for a class ? One minute ? Two ?
Why not help people help you ? Is it not better to make it easier to cooperate ?
On Mon, 11 Jan 2016 at 00:31, Alexandre Bergel alexandre.bergel@me.com wrote: I see the motivation, but things should go incrementally. If code should be highly documented, with a high test coverage, friendly to API migration then well.. not much happens…
Cheers, Alexandre
On Jan 10, 2016, at 5:24 PM, Sven Van Caekenberghe sven@stfx.eu wrote:
I think that we should not integrate new classes if they don't have a class comment that follow the template.
+100
I can understand that when prototype, hacking, being generally productive inside Pharo, you don't write comments at first. But once you go public, after some iterations, and especially if you want to be integrated into Pharo itself, there is no excuse. We need proper class comments, and comments for the main non-trivial public methods.
-- _,.;:~^~:;._,.;:~^~:;._,.;:~^~:;._,.;:~^~:;._,.;: Alexandre Bergel http://www.bergel.eu ^~:;._,.;:~^~:;._,.;:~^~:;._,.;:~^~:;._,.;:~^~:;.
Moose-dev mailing list Moose-dev@list.inf.unibe.ch https://www.list.inf.unibe.ch/listinfo/moose-dev _______________________________________________ Moose-dev mailing list Moose-dev@list.inf.unibe.ch https://www.list.inf.unibe.ch/listinfo/moose-dev
-- www.tudorgirba.com www.feenk.com
"Yesterday is a fact. Tomorrow is a possibility. Today is a challenge."
-
 Alexandre Bergel
 -
 Andrei Chis
 -
 Dimitris Chloupis
 -
 Ferlicot D. Cyril
 -
 Sven Van Caekenberghe
 -
 Tudor Girba