
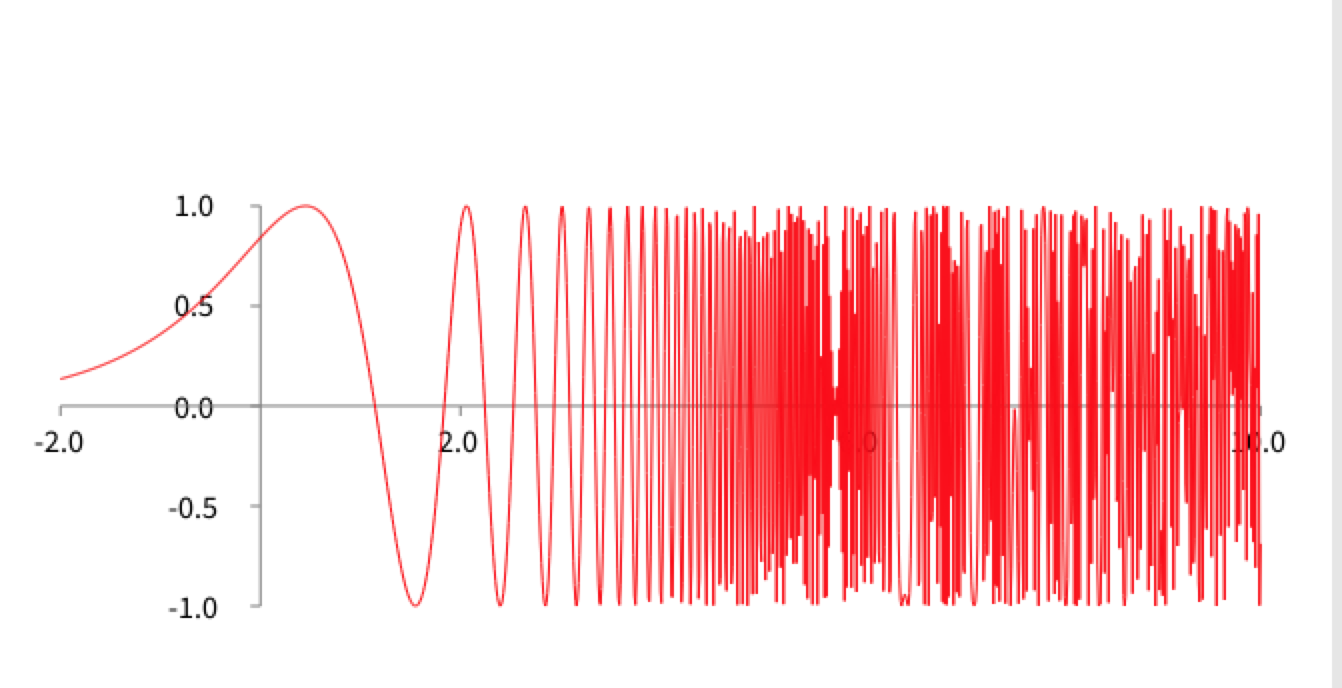
For some function, the Roassal Grapher is not really good. Try this for example:
b := RTGrapher new. b extent: 600 @ 200. ds := RTDataSet new. ds dotShape ellipse size: 0. ds points: (-2.0 to: 10.0 by: 0.001). ds connectColor: Color red. ds x: #yourself. ds y: [ :x | (x exp) sin ]. b add: ds. b axisXWithNumberOfTicks: 3. b axisYWithNumberOfTicks: 4. b build. b view
This is well known problem when someone use n-equally space joint in a grapher. There is some explanation here: http://maurizzzio.github.io/function-plot/
The solution need to implement an interval arithmetic library apparently. Nicolas implement an arbitrary-precision float library available in SciSmalltalk, but I not sure this is enough for a grapher.

Hi Serge,
I do not understand the problem you and the webpage mentioned. I do not see much difference between this n-equally space joint or not.
Alexandre
On Jun 28, 2015, at 1:24 PM, Serge Stinckwich serge.stinckwich@gmail.com wrote:
For some function, the Roassal Grapher is not really good. Try this for example:
b := RTGrapher new. b extent: 600 @ 200. ds := RTDataSet new. ds dotShape ellipse size: 0. ds points: (-2.0 to: 10.0 by: 0.001). ds connectColor: Color red. ds x: #yourself. ds y: [ :x | (x exp) sin ]. b add: ds. b axisXWithNumberOfTicks: 3. b axisYWithNumberOfTicks: 4. b build. b view
This is well known problem when someone use n-equally space joint in a grapher. There is some explanation here: http://maurizzzio.github.io/function-plot/
The solution need to implement an interval arithmetic library apparently. Nicolas implement an arbitrary-precision float library available in SciSmalltalk, but I not sure this is enough for a grapher.
-- Serge Stinckwich UCBN & UMI UMMISCO 209 (IRD/UPMC) Every DSL ends up being Smalltalk http://www.doesnotunderstand.org/ <Screen Shot 2015-06-28 at 18.05.57.png>_______________________________________________ Moose-dev mailing list Moose-dev@iam.unibe.ch https://www.iam.unibe.ch/mailman/listinfo/moose-dev
Ah yes, now I understand. Let’s discuss about this at esug
Alexandre
On Jun 28, 2015, at 1:24 PM, Serge Stinckwich serge.stinckwich@gmail.com wrote:
For some function, the Roassal Grapher is not really good. Try this for example:
b := RTGrapher new. b extent: 600 @ 200. ds := RTDataSet new. ds dotShape ellipse size: 0. ds points: (-2.0 to: 10.0 by: 0.001). ds connectColor: Color red. ds x: #yourself. ds y: [ :x | (x exp) sin ]. b add: ds. b axisXWithNumberOfTicks: 3. b axisYWithNumberOfTicks: 4. b build. b view
This is well known problem when someone use n-equally space joint in a grapher. There is some explanation here: http://maurizzzio.github.io/function-plot/
The solution need to implement an interval arithmetic library apparently. Nicolas implement an arbitrary-precision float library available in SciSmalltalk, but I not sure this is enough for a grapher.
-- Serge Stinckwich UCBN & UMI UMMISCO 209 (IRD/UPMC) Every DSL ends up being Smalltalk http://www.doesnotunderstand.org/ <Screen Shot 2015-06-28 at 18.05.57.png>_______________________________________________ Moose-dev mailing list Moose-dev@iam.unibe.ch https://www.iam.unibe.ch/mailman/listinfo/moose-dev
-
 Alexandre Bergel
 -
 Serge Stinckwich