
21 Jan
2016
21 Jan
'16
6:01 p.m.
Hi!
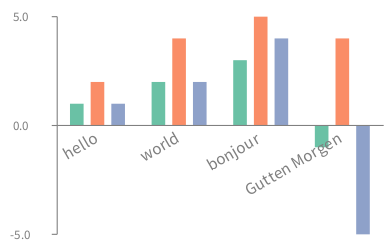
Just in case you did not know, we have a MultipleData to chart using bars several data sets. For example: -=-=-=-=-=-=-=-=-= b := RTGrapher new.
d := RTMultipleData new. d barShape color: Color blue. d points: #( #('hello' 1 2 1) #('world' 2 4 2) #('bonjour' 3 5 4) #('Gutten Morgen' -1 4 -5)). d addMetric: #second. d addMetric: #third. d addMetric: #fourth.
"d barChartWithBarCenteredTitle: #first." d barChartWithBarTitle: #first rotation: -30.
b add: d. b -=-=-=-=-=-=-=-=-=
Cheers, Alexandre
--
_,.;:~^~:;._,.;:~^~:;._,.;:~^~:;._,.;:~^~:;._,.;:
Alexandre Bergel http://www.bergel.eu
^~:;._,.;:~^~:;._,.;:~^~:;._,.;:~^~:;._,.;:~^~:;.