
Hi!
Here is a small script I have written for a robotic application. You can use RTComposer to put several graphs next to each other. There is nothing new in that respect, but it is worth illustrating it once in a while...
Here is an example:
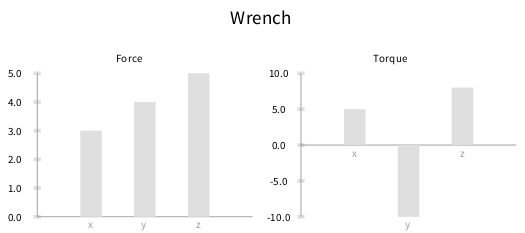
-=-=-=-=-=-=-=-=-=-=-=-=-=-=-=-=-=-=-=-=-=-=-=-=-=-=-=-=-=-=-=-=-=-=-= force := { {'x' . 3 }. { 'y' . 4 } . { 'z' . 5 } }. torque := { {'x' . 5 }. { 'y' . -10 } . { 'z' . 8 } }.
composer := RTComposer new. "-------------" "Force" b := RTGrapher new. b view: composer view. ds := RTStackedDataSet new. ds points: force. ds y: #second. ds barShape width: 30. ds histogramWithBarTitle: #first rotation: 0. b add: ds. b axisX noLabel; noTick. b build. composer group: #force. "-------------" "Torque" b := RTGrapher new. b view: composer view. ds := RTStackedDataSet new. ds points: torque. ds y: #second. ds barShape width: 30. ds histogramWithBarTitle: #first rotation: 0.
b add: ds.
b axisX noLabel; noTick. b build. composer group: #torque.
"-------------" "Doing the layout of the graphs" composer move: #force onTheLeftOf: #torque. composer nameGroup: #force as: 'Force'. composer nameGroup: #torque as: 'Torque'. composer setGeneralTitle: 'Wrench'. composer view. -=-=-=-=-=-=-=-=-=-=-=-=-=-=-=-=-=-=-=-=-=-=-=-=-=-=-=-=-=-=-=-=-=-=-=
You obtain:
You need to update Roassal for this last example (I have added #setGeneralTitle:).
Cheers, Alexandre