
Dear all,
I'm currently working on a process mining tool that should allow the extraction of processes from events log. I will present this work during the next MOOSEDAY at Paris.
At the moment, thanks to the Moose-Algo-Graph package, I'm able to build Petri-nets from an event log.
I would like to able to visualize the resulting Petri-net with ROASSAL. In a MOOSE 5.0 image :
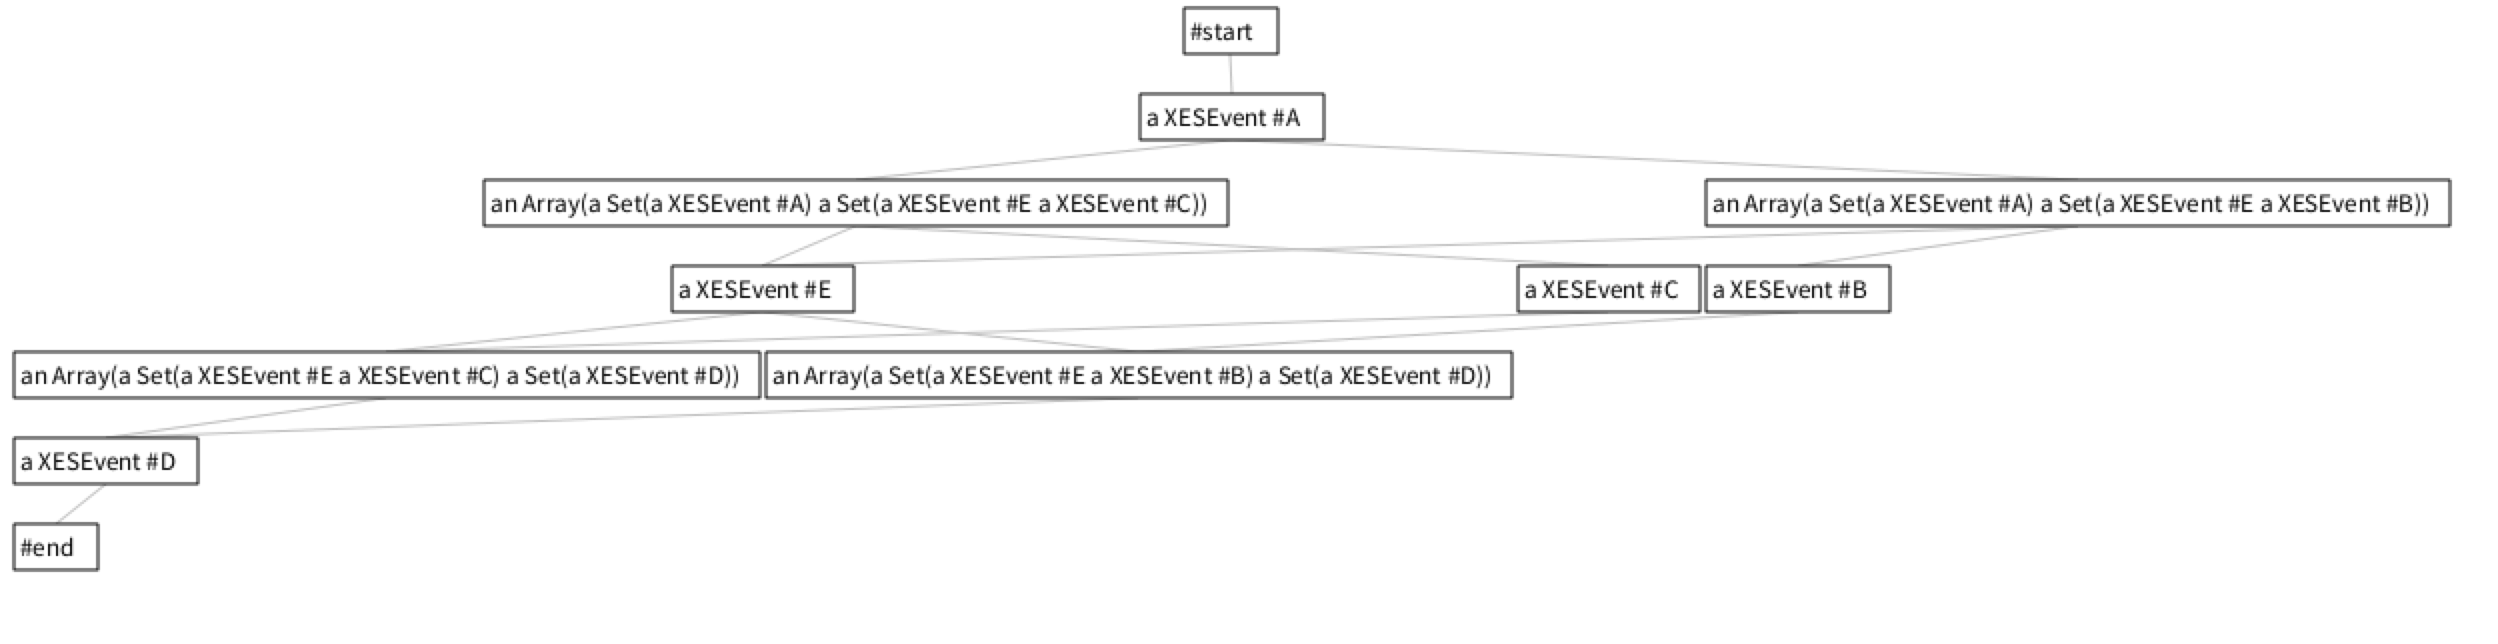
=========================================================== Gofer it url: 'http://smalltalkhub.com/mc/SergeStinckwich/Moose-XES/main'; package: 'Moose-XES'; load. | graph view | graph := (XESAlphaAlgorithm on: (XESParser parseString: XESParserTest new example1)) run. view := ROMondrianViewBuilder new. view shape rectangle withText: [ :n | n model printString ]. view nodes: graph nodes. view edges: graph edges from: #from to: #to. view interaction. view treeLayout. view open =========================================================== See the picture include.
Show I use a GraphBuilder in order to have something better ?
====================================================================== b := RTGraphBuilder new. graph := (XESAlphaAlgorithm on: (XESParser parseString: XESParserTest new example1)) run. b nodes if:[:m| m type = #transition]; shape:(RTEllipse new size: 20). b nodes if:[:m| m type = #place]; shape:(RTBox new size: 20). b addAll: graph nodes. b layout use: RTTreeLayout new. b ======================================================================
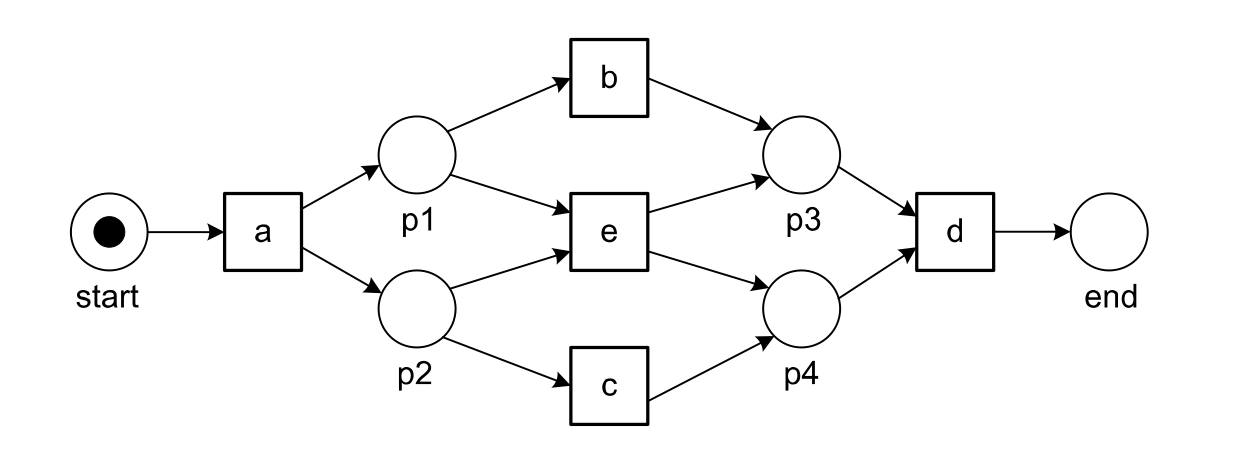
How I could add the edges and a layout that is more similar to the following one ?
Regards,