
23 Sep
2015
23 Sep
'15
10:52 p.m.
Hi!
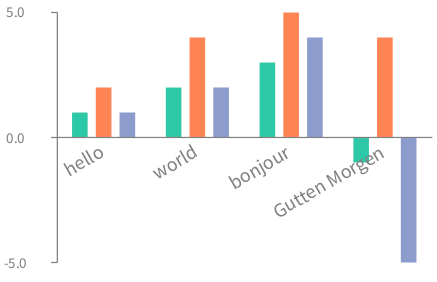
As promised, here is a first try of multi point chart.
-=-=-=-=-=-=-=-= b := RTGrapher new.
d := RTMultipleData new. d barShape color: Color blue. d points: #( #('hello' 1 2 1) #('world' 2 4 2) #('bonjour' 3 5 4) #('Gutten Morgen' -1 4 -5)). d addMetric: #second. d addMetric: #third. d addMetric: #fourth.
"d barChartWithBarCenteredTitle: #first." d barChartWithBarTitle: #first rotation: -30.
b add: d.
b -=-=-=-=-=-=-=-=
Feedback are welcome!
@Thomas: The VisualWorks version will follow very soon.
Cheers, Alexandre
--
_,.;:~^~:;._,.;:~^~:;._,.;:~^~:;._,.;:~^~:;._,.;:
Alexandre Bergel http://www.bergel.eu
^~:;._,.;:~^~:;._,.;:~^~:;._,.;:~^~:;._,.;:~^~:;.