
There are numerous ways to draw an histogram.
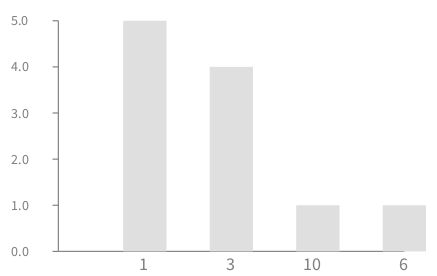
Here some examples: b := Bag new. b add: 1 withOccurrences: 5. b add: 3 withOccurrences: 4. b add: 6. b add: 10. v := RTGrapher new. ds := RTData new. ds interaction popup. ds points: b valuesAndCounts keys. ds y: [:c|b valuesAndCounts at: c] . ds barChartWithBarTitle: #yourself rotation: 0. v add: ds. v axisX noTick. v
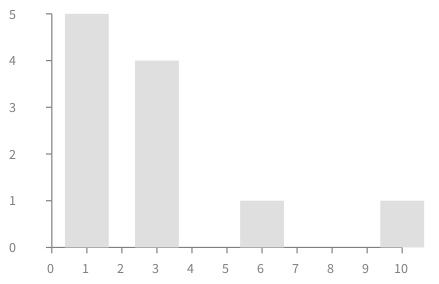
b := Bag new. b add: 1 withOccurrences: 5. b add: 3 withOccurrences: 4. b add: 6. b add: 10. v := RTGrapher new. ds := RTData new. ds interaction popup. ds points: b valuesAndCounts keys. ds y: [ :c|b valuesAndCounts at: c] . ds x: #yourself. ds barShape. v add: ds. v axisX numberOfLabels: 10; noDecimal. v axisY noDecimal. v
Indeed, #histogram is buggy.
Alexandre
On Feb 15, 2016, at 6:37 PM, Sven Van Caekenberghe sven@stfx.eu wrote:
The Roassal #histogram should just work in a cool way.
Make easy things easy, you will get great response.
On 15 Feb 2016, at 17:34, Serge Stinckwich serge.stinckwich@gmail.com wrote:
In a playground, I try:
b := Bag new. b add: 1 withOccurrences: 5. b add: 3 withOccurrences: 4. b add: 6. b asArray histogram
But the result is buggy apparently ...
On Mon, Feb 15, 2016 at 3:22 PM, stepharo stepharo@free.fr wrote:
Hi
I have a bag
b := Bag new. b add: 1 withOccurrences: 5. b add: 3 withOccurrences: 4. b add: 6. b
and I would like to display it as an histogram with roassal.
Stef _______________________________________________ Moose-dev mailing list Moose-dev@list.inf.unibe.ch https://www.list.inf.unibe.ch/listinfo/moose-dev
-- Serge Stinckwich UCBN & UMI UMMISCO 209 (IRD/UPMC) Every DSL ends up being Smalltalk http://www.doesnotunderstand.org/ <Screen Shot 2016-02-15 at 17.33.44.png>_______________________________________________ Moose-dev mailing list Moose-dev@list.inf.unibe.ch https://www.list.inf.unibe.ch/listinfo/moose-dev
Moose-dev mailing list Moose-dev@list.inf.unibe.ch https://www.list.inf.unibe.ch/listinfo/moose-dev