Hi Hernán,
I am not sure what exactly is the problematic situation you describe. Why you cannot simply with with #minX: and #maxX: ?
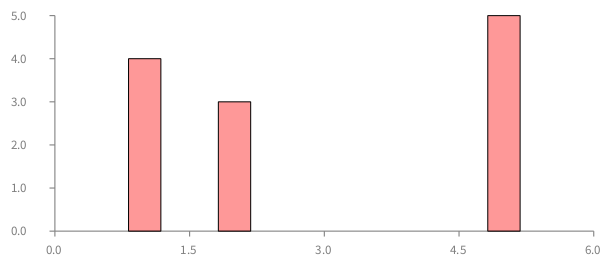
For example, I tried to reuse the code you have provided. I can have:
bins := #(#(1 1 1 1 ) #(2 2 2) #(5 5 5 5 5)).
minPoint := ((bins reject: #isEmpty) detectMin: [ : c | c size ]) anyOne.
" Build diagram "
g := RTGrapher new
extent: 500 @ 200;
minX: 0;
maxX: 6;
withoutOrigin;
yourself.
ds := RTData new
points: bins;
x: [ : c | c ifEmpty: [ minPoint ] ifNotEmpty: [ : d | d anyOne ] ];
y: #size.
ds barShape
borderColor: Color black;
color: Color red trans;
width: 30.
g add: ds.
g
But you can have "minX: 1", which in that case, the first bar is above the Y-Axis. This is what one would expect.
Which rendering do you wish to have? Can you provide a self-contained piece of code that I can run on my machine?
Cheers,
Alexandre
--
_,.;:~^~:;._,.;:~^~:;._,.;:~^~:;._,.;:~^~:;._,.;:
Alexandre Bergel
http://www.bergel.eu
^~:;._,.;:~^~:;._,.;:~^~:;._,.;:~^~:;._,.;:~^~:;.
> On Jun 15, 2017, at 1:16 AM, Hernán Morales Durand
hernan.morales@gmail.com wrote:
>
> Hi guys,
>
> I am experiencing a problem visualizing histograms in Roassal with Pharo 5. In the attached image you can observe the first bar shape starts from a negative X axis value, where I want to start from 0. Besides, some bars are gapped but I don't know why.
>
> I am using with the following code:
>
> | bins minPoint g ds |
>
> bins := self groupedBySeqLengthDistribution: binNumber.
> minPoint := ((bins reject: #isEmpty) detectMin: [ : c | c size ]) anyOne size.
>
> " Build diagram "
> g := RTGrapher new
> extent: 500 @ 200;
> minX: minPoint;
> withoutOrigin;
> yourself.
> ds := RTData new
> points: bins;
> x: [ : c | c ifEmpty: [ minPoint ] ifNotEmpty: [ : d | d anyOne size ] ];
> y: #size.
> ds barShape
> borderColor: Color black;
> color: aColor;
> width: barWidth.
> g add: ds.
>
> " Configure axis settings "
> g axisY
> title: axixYLabel;
> color: Color black;
> noDecimal.
> g axisX
> noDecimal;
> fromPoint: minPoint;
> color: Color black;
> title: axisXLabel.
> " Open visualization in a new window "
> g open.
>
> Any idea what I am missing?
>
> Cheers,
>
> Hernán
> <Roassal.jpeg>_______________________________________________
> Moose-dev mailing list
> Moose-dev@list.inf.unibe.ch
>
https://www.list.inf.unibe.ch/listinfo/moose-dev
