
Hi,
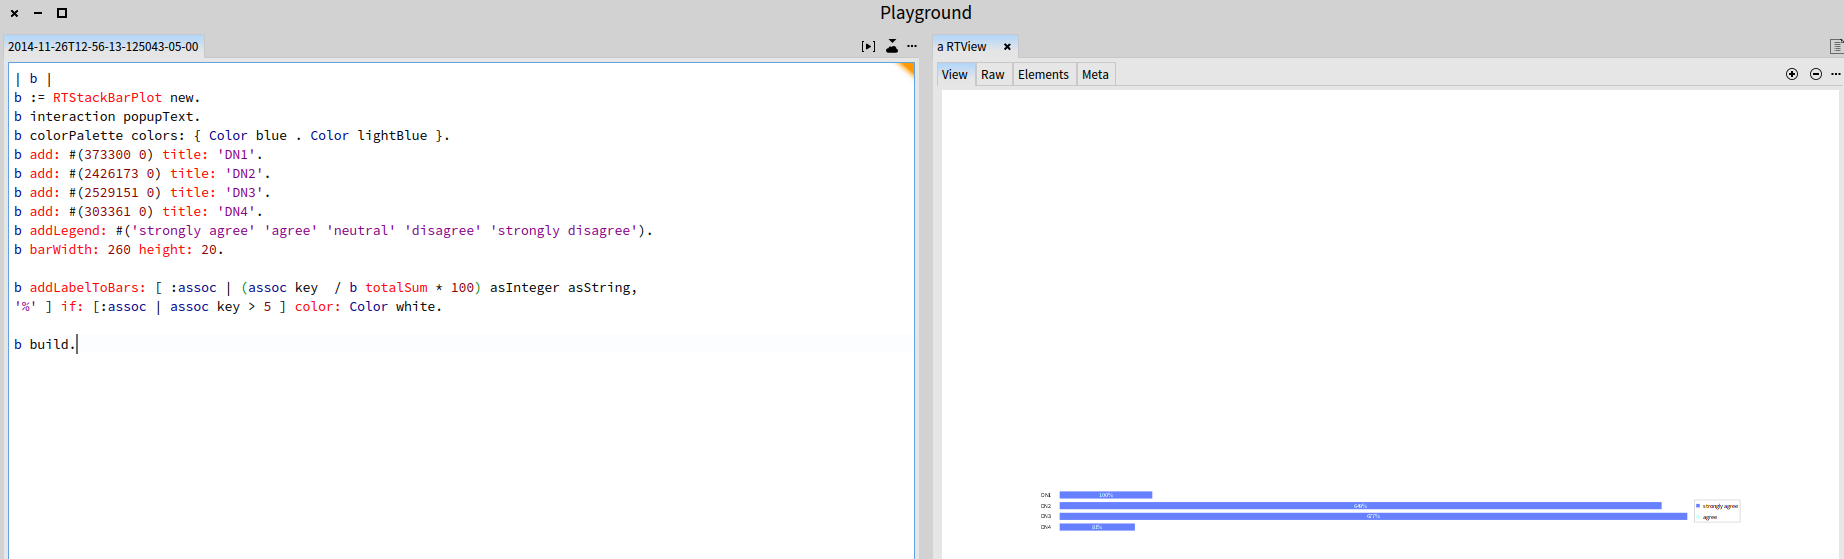
My graphic went pretty differently. See attached screenshot.
I'm using Roassal2-PierreChanson.659.mcz, there is something else I need to update to get this stack bar plot?
Cheers,
Offray
El 12/12/14 a las 14:18, Alexandre Bergel escribió:
Hi!
Today Andrei and I pair-programmed on a stack bar plot builder.
Here is an example:
b := RTStackBarPlot new. b interaction popupText. b colorPalette colors: { Color blue . Color lightBlue }. b add: #(373300 0) title: 'DN1'. b add: #(2426173 0) title: 'DN2'. b add: #(2529151 0) title: 'DN3'. b add: #(303361 0) title: 'DN4'. b addLegend: #('strongly agree' 'agree' 'neutral' 'disagree' 'strongly disagree'). b barWidth: 260 height: 20.
b addLabelToBars: [ :assoc | (assoc key / b totalSum * 100) asInteger asString, '%' ] if: [:assoc | assoc key > 5 ] color: Color white.
b build.
Result is the following:
Cheers, Andrei & Alexandre -- _,.;:~^~:;._,.;:~^~:;._,.;:~^~:;._,.;:~^~:;._,.;: Alexandre Bergel http://www.bergel.eu ^~:;._,.;:~^~:;._,.;:~^~:;._,.;:~^~:;._,.;:~^~:;.
Moose-dev mailing list Moose-dev@iam.unibe.ch https://www.iam.unibe.ch/mailman/listinfo/moose-dev