
30 Apr
2015
30 Apr
'15
10:43 p.m.
I very much like these enhancements.
On Thu, Apr 30, 2015 at 11:00 AM, Alexandre Bergel alexandre.bergel@me.com wrote:
Hi!
We did a number of improvements of Grapher for Thomas. I am sharing them since some of you may find it relevant.
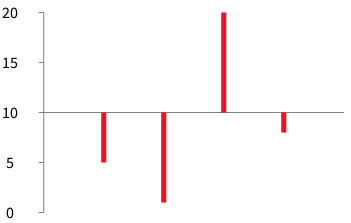
*** Tip: need to shift the Y-axis ***
b := RTGrapher new. ds := RTStackedDataSet new. ds barShape color: Color red. ds points: #(5 1 20 8). b add: ds. b axisX noLabel; noTick. b axisY noDecimal.
I REALLY like the noDecimal option!
<snip>
Is there a way to set the colors differently for above/below the shifted y axis? Above is green (no issues); below is red (issues). Or, depending on what is being discussed, the exact opposite?
-cbc