From your description, I have doubt that you really need an histogram.
=-=-=-==-=-=-==-=-=-==-=-=-=
data := {
Dictionary new
at: 'COLOR' put: Color gray;
at: 'TIME' put: (DateAndTime fromString: '2014-10-30 12:11:28.0');
at: 'SECONDS' put: 4;
yourself.
Dictionary new
at: 'COLOR' put: Color gray;
at: 'TIME' put: (DateAndTime fromString: '2014-10-31 12:11:28.0');
at: 'SECONDS' put: 5;
yourself.
Dictionary new
at: 'COLOR' put: Color red;
at: 'TIME' put: (DateAndTime fromString: '2014-10-31 12:41:28.0');
at: 'SECONDS' put: 15;
yourself.
Dictionary new
at: 'COLOR' put: Color green;
at: 'TIME' put: (DateAndTime fromString: '2014-11-01 12:11:28.0');
at: 'SECONDS' put: 7;
yourself.
Dictionary new
at: 'COLOR' put: Color gray;
at: 'TIME' put: (DateAndTime fromString: '2014-11-02 12:11:28.0');
at: 'SECONDS' put: 1;
yourself.
Dictionary new
at: 'COLOR' put: Color gray;
at: 'TIME' put: (DateAndTime fromString: '2014-11-03 12:11:28.0');
at: 'SECONDS' put: 4;
yourself.
}.
oldestEntryDate := (data collect: [ :entry | (entry at: 'TIME') asUnixTime ]) min.
b := RTCharterBuilder new.
b extent: 300 @ 200.
b shape rectangle size: 0.
b points: data.
b y: [ :entry | entry at: 'SECONDS' ].
firstDay := (data collect: [ :d| d at: 'TIME' ]) min.
base := firstDay julianDayNumber.
firstDay := (firstDay asDuration asMinutes) floor + (firstDay julianDayNumber * 1440).
b allX: [ :v | (v at: 'TIME') asUnixTime - oldestEntryDate ].
b shape rectangle
width: 5;
color: [ :entry | entry at: 'COLOR' ].
b interaction
highlightColored: Color red.
b histogramWithBarTitle: [ :entry | '' ] width: 5.
b axisY.
"b newAxisConfiguration plain."
b axisConfiguration
title: '';
labelRotation: -30;
numberOfTicks: 4;
numberOfLabels: 4;
labelConvertion: [ :v | Transcript show: v asString; cr. Date julianDayNumber: (v / 1440) rounded + base ].
b axisX.
b build.
b view
=-=-=-==-=-=-==-=-=-==-=-=-=
I use asUnixTime instead of the floor, minutes, and julianDayNumber conversions.
--
_,.;:~^~:;._,.;:~^~:;._,.;:~^~:;._,.;:~^~:;._,.;:
Alexandre Bergel
http://www.bergel.eu
^~:;._,.;:~^~:;._,.;:~^~:;._,.;:~^~:;._,.;:~^~:;.
> On Nov 4, 2014, at 8:32 PM, Chris Cunningham
cunningham.cb@gmail.com wrote:
>
> Hi Alexandre,
> this is close. It at least mirrors what I could get elsewhere (with work).
>
> What I'd really like is:
> 1. To just have the DATE shown on the X axis (easy to do)
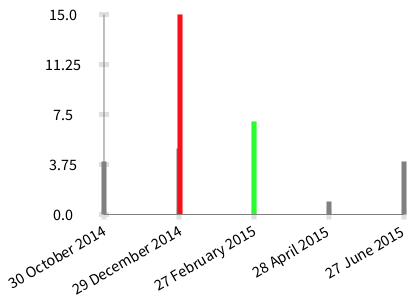
> 2. To have the bars be places on the X axis relative to where they would be in a timeline. Harder to do - maybe need to make the values based on minutes since first value? or beginning of first day? I think I might see this - but previous examples seem to use scatter type plots - and not histograms. (Hmm, figured it out!)
> 3. To have the bars be skinny enough (when needed) to show the close times.
>
> If you look at the data, the gray and green bars are all 1 day apart from each other. The RED one is 1/2 hour after the second gray one - it would be nice to show them that close together.
>
> This code gets close - just need to shape the bars reasonably (the second gray bar is almost completely hidden):
>
> -=-=-=-=-=-=-=-=-=-=-=-=
> data := {
> Dictionary new
> at: 'COLOR' put: Color gray;
> at: 'TIME' put: (DateAndTime fromString: '2014-10-30 12:11:28.0');
> at: 'SECONDS' put: 4;
> yourself.
> Dictionary new
> at: 'COLOR' put: Color gray;
> at: 'TIME' put: (DateAndTime fromString: '2014-10-31 12:11:28.0');
> at: 'SECONDS' put: 5;
> yourself.
> Dictionary new
> at: 'COLOR' put: Color red;
> at: 'TIME' put: (DateAndTime fromString: '2014-10-31 12:41:28.0');
> at: 'SECONDS' put: 15;
> yourself.
> Dictionary new
> at: 'COLOR' put: Color green;
> at: 'TIME' put: (DateAndTime fromString: '2014-11-01 12:11:28.0');
> at: 'SECONDS' put: 7;
> yourself.
> Dictionary new
> at: 'COLOR' put: Color gray;
> at: 'TIME' put: (DateAndTime fromString: '2014-11-02 12:11:28.0');
> at: 'SECONDS' put: 1;
> yourself.
> Dictionary new
> at: 'COLOR' put: Color gray;
> at: 'TIME' put: (DateAndTime fromString: '2014-11-03 12:11:28.0');
> at: 'SECONDS' put: 4;
> yourself.
> }.
> b := RTCharterBuilder new.
> b extent: 300 @ 200.
> b shape rectangle size: 0.
> b points: data.
> b y: [ :entry | entry at: 'SECONDS' ].
> firstDay := (data collect: [ :d| d at: 'TIME' ]) min.
> base := firstDay julianDayNumber.
> firstDay := (firstDay asDuration asMinutes) floor + (firstDay julianDayNumber * 1440).
> b allX: [ :v | ((v at: 'TIME') asDuration asMinutes) floor + ((v at: 'TIME') julianDayNumber * 1440) - firstDay ].
>
> b shape rectangle
> color: [ :entry | entry at: 'COLOR' ].
>
> b interaction
> highlightColored: Color red.
>
> b histogramWithBarTitle: [ :entry | '' ].
>
> b axisY.
> "b newAxisConfiguration plain."
> b axisConfiguration
> title: '';
> labelRotation: -30;
> numberOfTicks: 4;
> numberOfLabels: 4;
> labelConvertion: [ :v | Transcript show: v asString; cr. Date julianDayNumber: (v / 1440) rounded + base ].
> b axisX.
> b build.
> b view
> -=-=-=-=-=-=-=-=-=-=-=-=
> <image.png>
>
> On Tue, Nov 4, 2014 at 2:17 PM, Alexandre Bergel <alexandre.bergel@me.com
mailto:alexandre.bergel@me.com> wrote:
> Hi Chris!
>
> A first and quick try of your data gave me:
>
> -=-=-=-=-=-=-=-=-=-=-=-=
> data := {
> Dictionary new
> at: 'COLOR' put: Color gray;
> at: 'TIME' put: (DateAndTime fromString: '2014-10-30 12:11:28.0');
> at: 'SECONDS' put: 4;
> yourself.
> Dictionary new
> at: 'COLOR' put: Color gray;
> at: 'TIME' put: (DateAndTime fromString: '2014-10-31 12:11:28.0');
> at: 'SECONDS' put: 5;
> yourself.
> Dictionary new
> at: 'COLOR' put: Color red;
> at: 'TIME' put: (DateAndTime fromString: '2014-10-31 12:41:28.0');
> at: 'SECONDS' put: 15;
> yourself.
> Dictionary new
> at: 'COLOR' put: Color green;
> at: 'TIME' put: (DateAndTime fromString: '2014-11-01 12:11:28.0');
> at: 'SECONDS' put: 7;
> yourself.
> Dictionary new
> at: 'COLOR' put: Color gray;
> at: 'TIME' put: (DateAndTime fromString: '2014-11-02 12:11:28.0');
> at: 'SECONDS' put: 1;
> yourself.
> Dictionary new
> at: 'COLOR' put: Color gray;
> at: 'TIME' put: (DateAndTime fromString: '2014-11-03 12:11:28.0');
> at: 'SECONDS' put: 4;
> yourself.
> }.
> b := RTCharterBuilder new.
> b extent: 300 @ 200.
> b shape rectangle size: 0.
> b points: data.
> b y: [ :entry | entry at: 'SECONDS' ].
> b stackX.
> b shape rectangle
> color: [ :entry | entry at: 'COLOR' ].
>
> b interaction
> highlightColored: Color red.
>
> b histogramWithBarTitle: [ :entry | entry at: 'TIME' ].
>
> b axisY.
> b newAxisConfiguration plain.
> b axisX.
> b build.
> b view
> -=-=-=-=-=-=-=-=-=-=-=-=
>
> <Screen Shot 2014-11-04 at 7.16.37 PM.png>
>
> Is this what you expect?
>
> Cheers,
> Alexandre
> --
> _,.;:~^~:;._,.;:~^~:;._,.;:~^~:;._,.;:~^~:;._,.;:
> Alexandre Bergel
http://www.bergel.eu http://www.bergel.eu/
> ^~:;._,.;:~^~:;._,.;:~^~:;._,.;:~^~:;._,.;:~^~:;.
>
>
>
>> On Nov 4, 2014, at 5:41 PM, Chris Cunningham <cunningham.cb@gmail.com
mailto:cunningham.cb@gmail.com> wrote:
>>
>> I am currently using EyeSee for doing some charting/graphing, and am running into some of its limitations. I'd like to use the newest/bestest, but am stumped how to use it right now.
>>
>> Attached is roughly the graph I want:<image.png>
>> except I'd like the bars to be located correctly for the time (as well as the labels). Or, even better, be able to state that I want the days labelled, and either hour tick marks, or optional tick marks. And, of course, be able to specifically call out the color of the bars.
>>
>> Data to build this chart:
>> x := {
>> Dictionary new
>> at: 'COLOR' put: Color gray;
>> at: 'TIME' put: (DateAndTime fromString: '2014-10-30 12:11:28.0');
>> at: 'SECONDS' put: 4;
>> yourself.
>> Dictionary new
>> at: 'COLOR' put: Color gray;
>> at: 'TIME' put: (DateAndTime fromString: '2014-10-31 12:11:28.0');
>> at: 'SECONDS' put: 5;
>> yourself.
>> Dictionary new
>> at: 'COLOR' put: Color red;
>> at: 'TIME' put: (DateAndTime fromString: '2014-10-31 12:41:28.0');
>> at: 'SECONDS' put: 15;
>> yourself.
>> Dictionary new
>> at: 'COLOR' put: Color green;
>> at: 'TIME' put: (DateAndTime fromString: '2014-11-01 12:11:28.0');
>> at: 'SECONDS' put: 7;
>> yourself.
>> Dictionary new
>> at: 'COLOR' put: Color gray;
>> at: 'TIME' put: (DateAndTime fromString: '2014-11-02 12:11:28.0');
>> at: 'SECONDS' put: 1;
>> yourself.
>> Dictionary new
>> at: 'COLOR' put: Color gray;
>> at: 'TIME' put: (DateAndTime fromString: '2014-11-03 12:11:28.0');
>> at: 'SECONDS' put: 4;
>> yourself.
>> }.
>>
>> -cbc
>> _______________________________________________
>> Moose-dev mailing list
>> Moose-dev@iam.unibe.ch
mailto:Moose-dev@iam.unibe.ch
>>
https://www.iam.unibe.ch/mailman/listinfo/moose-dev https://www.iam.unibe.ch/mailman/listinfo/moose-dev
>
>
> _______________________________________________
> Moose-dev mailing list
> Moose-dev@iam.unibe.ch
mailto:Moose-dev@iam.unibe.ch
>
https://www.iam.unibe.ch/mailman/listinfo/moose-dev https://www.iam.unibe.ch/mailman/listinfo/moose-dev
>
>
> _______________________________________________
> Moose-dev mailing list
> Moose-dev@iam.unibe.ch
>
https://www.iam.unibe.ch/mailman/listinfo/moose-dev
