
Hi Pablo,
Welcome. Beautiful start :)
Would it be possible to create a configuration for GraphET2?
Keep it up.
Cheers, Doru
On Thu, Mar 13, 2014 at 9:26 PM, Pablo Estefó pestefo@gmail.com wrote:
Hi folks,
I am Pablo Estefó an ObjectProfile engineer and I will continue the excellent work of Daniel Aviv on Graph-ET (on Roassal2http://smalltalkhub.com/#!/~ObjectProfile/Roassal2 ).
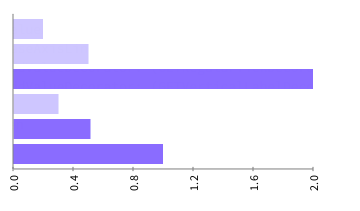
I've just added the "oblique" labels feature(for Roassal2's GraphEThttp://smalltalkhub.com/#!/~DanielAvivNotario/GraphET2 version only). And the result is something like this:
=~=~=~=~=~=~=~=~=~=~=~=~=~=~=~=~=~=~=~=~ | diagram | diagram := GETDiagramBuilder new. diagram horizontalBarDiagram models: #(0.2 0.5 2 0.3 0.51 1); color: [ :x | x <= 0.5 ifTrue: [ Color blue alpha: 0.2 ] ifFalse: [Color blue alpha: 0.5]]; valueAxisLine; baseAxisLine; addValueDecorator: (GETRegularTickDecorator new numberOfTicks: 5); addValueDecorator: (*GETRotatedLabelDecorator new diagonal numberOfLabels: 5*).
diagram open =~=~=~=~=~=~=~=~=~=~=~=~=~=~=~=~=~=~=~=~
It produces:
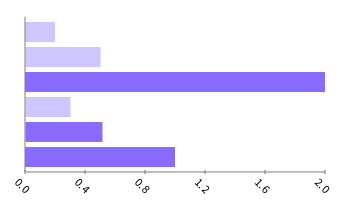
If we change the rotated label as diagonal inverted:
=~=~=~=~=~=~=~=~=~=~=~=~=~=~=~=~=~=~=~=~ | diagram | diagram := GETDiagramBuilder new. diagram horizontalBarDiagram models: #(0.2 0.5 2 0.3 0.51 1); color: [ :x | x <= 0.5 ifTrue: [ Color blue alpha: 0.2 ] ifFalse: [Color blue alpha: 0.5]]; valueAxisLine; baseAxisLine; addValueDecorator: (GETRegularTickDecorator new numberOfTicks: 5); addValueDecorator: (*GETRotatedLabelDecorator new diagonalInverted numberOfLabels: 5*).
diagram open =~=~=~=~=~=~=~=~=~=~=~=~=~=~=~=~=~=~=~=~
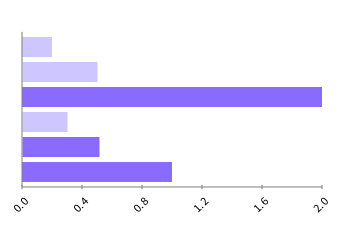
Vertical labels =~=~=~=~=~=~=~=~=~=~=~=~=~=~=~=~=~=~=~=~ | diagram | diagram := GETDiagramBuilder new. diagram horizontalBarDiagram models: #(0.2 0.5 2 0.3 0.51 1); color: [ :x | x <= 0.5 ifTrue: [ Color blue alpha: 0.2 ] ifFalse: [Color blue alpha: 0.5]]; valueAxisLine; baseAxisLine; addValueDecorator: (GETRegularTickDecorator new numberOfTicks: 5); addValueDecorator: (*GETVerticalLabelDecorator new numberOfLabels: 5*).
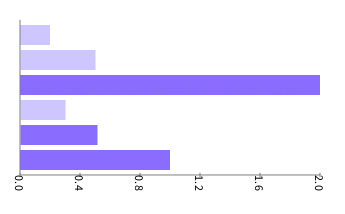
diagram open =~=~=~=~=~=~=~=~=~=~=~=~=~=~=~=~=~=~=~=~ Vertical labels =~=~=~=~=~=~=~=~=~=~=~=~=~=~=~=~=~=~=~=~ | diagram | diagram := GETDiagramBuilder new. diagram horizontalBarDiagram models: #(0.2 0.5 2 0.3 0.51 1); color: [ :x | x <= 0.5 ifTrue: [ Color blue alpha: 0.2 ] ifFalse: [Color blue alpha: 0.5]]; valueAxisLine; baseAxisLine; addValueDecorator: (GETRegularTickDecorator new numberOfTicks: 5); addValueDecorator: (*GETVerticalLabelDecorator new inverted numberOfLabels: 5*).
diagram open =~=~=~=~=~=~=~=~=~=~=~=~=~=~=~=~=~=~=~=~ I am thinking a succinct way to specify it.
Well, as you can see the axis configuration will get more complex the more options we can provide. So our next question to drive our development is: How can we get the richest input in order to interpret it and return the best plot with the minimum configuration input.
I would like to know your opinions to develop a better Graph-ET :-)
Cheers, Pablo
Moose-dev mailing list Moose-dev@iam.unibe.ch https://www.iam.unibe.ch/mailman/listinfo/moose-dev