
Hi Hernán,
The attached capture is the one implemented by the method #exampledoubleCurves.
If you zoom the image you will notice the grey edge of each green and blue line. The same happens in #exampleVerticalAndHorizontalLines
Is there a way to remove it the grey around each line?
The grey outline are actually the dots.
You need to write “ds noDot” before calling “points:” Here is an example:
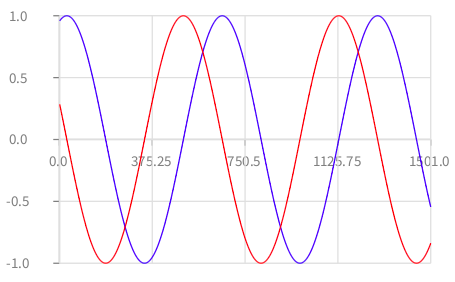
| b ds | b := RTGrapher new.
b extent: 300 @ 200.
ds := RTData new. ds noDot. ds points: (-50 to: 100 by: 0.1). ds y: [ :x | (0.1 * x) sin ]. ds noDot. ds interaction popupText: 'sinus'. ds connectColor: Color blue. b add: ds.
ds := RTData new. ds noDot. ds points: (-50 to: 100 by: 0.1). ds y: [ :x | (0.1 * x) cos ]. ds noDot. ds interaction popupText: 'cosinus'. ds connectColor: Color red. b add: ds.
b addDecorator: RTHorizontalTickLineDecorator new. b addDecorator: RTVerticalTickLineDecorator new.
^ b Which produces:
I have updated these example. Indeed, there is no good reason of having the dots.
Alexandre
Cheers,
Hernán
<grey_line.png>_______________________________________________ Moose-dev mailing list Moose-dev@list.inf.unibe.ch https://www.list.inf.unibe.ch/listinfo/moose-dev