
Hi!
I relaxed a bit by implementing something that was missing in Grapher.
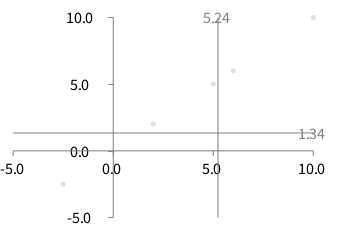
Consider the following code: -=-=-=-=-=-=-=-=-=-=-=-= b := RTGrapher new.
ds := RTDataSet new. ds points: #(5 10 6 2 -2.5). b add: ds.
“below is the magic line" b addDecorator: RTCursorFollower new. b -=-=-=-=-=-=-=-=-=-=-=-=
This “magic line” add two bar that follows the mouse cursor. Here is a screenshot:
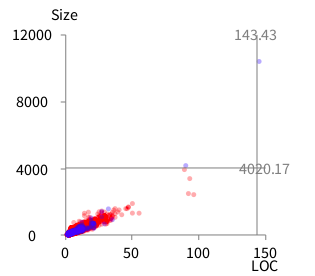
Here is on a larger example: -=-=-=-=-=-=-=-=-=-=-=-=-=-=-=-=-=-=-=-= | methods trachelMethods b ds | methods := Collection withAllSubclasses flatCollect: #rtmethods. trachelMethods := TRObject withAllSubclasses flatCollect: #rtmethods.
b := RTGrapher new. b extent: 200 @ 200.
"Data set 1" ds := RTDataSet new. ds interaction popup. ds dotShape circle color: (Color red alpha: 0.3). ds points: methods. ds x: #numberOfLinesOfCode. ds y: [ :m | m getSource size ]. b add: ds.
"Data set 2" ds := RTDataSet new. ds interaction popup. ds dotShape circle color: (Color blue alpha: 0.3). ds points: trachelMethods. ds x: #numberOfLinesOfCode. ds y: [ :m | m getSource size ]. b add: ds.
b axisX withThousandsSeparator; title: 'LOC'. b axisY noDecimal; title: 'Size'. b addDecorator: RTCursorFollower new. b build.
^ b view -=-=-=-=-=-=-=-=-=-=-=-=-=-=-=-=-=-=-=-=
Maybe this cursor follower should be per default in all produced chart. Any opinion?
Cheers, Alexandre