Hi Baptiste!
I think this is your first email to the mailing list, so welcome!
There are many different ways to do this.
One easy way is to use the graph builder.
-=-=-=-=-=-=-=-=-=-=-=-=-=-=-=-=
| b |
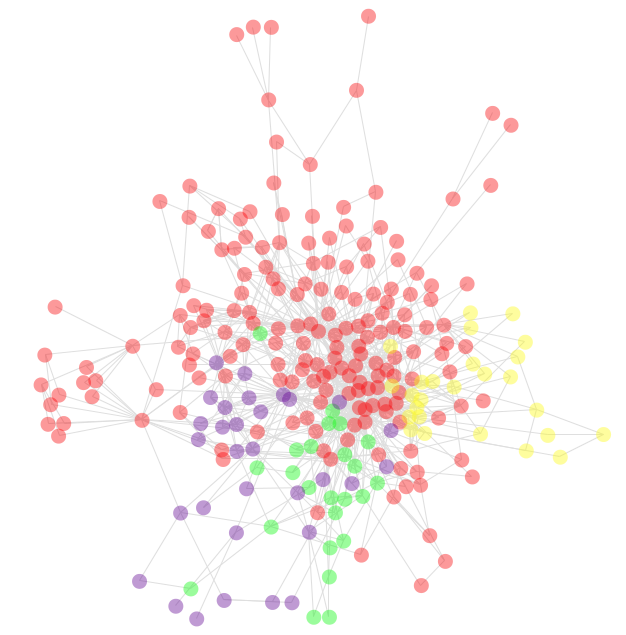
b := RTGraphBuilder new.
b nodes
if: [ :c | c inheritsFrom: RTShape ];
color: Color green.
b nodes
if: [ :c | c inheritsFrom: RTLayout ];
color: Color yellow.
b nodes
if: [ :c | 'TR*' match: c name ];
color: Color purple.
b nodes color: Color red.
b edges
connectTo: #dependentClasses;
useInLayout.
b layout force charge: -100.
b global
minSize: 15;
alphaColor: 0.4.
b addAll: RTObject withAllSubclasses, TRObject withAllSubclasses.
b open.
b view canvas
-=-=-=-=-=-=-=-=-=-=-=-=-=-=-=-=
Which produce the following:
I suggest you to have a look at the example.
Cheers,
Alexandre
--
_,.;:~^~:;._,.;:~^~:;._,.;:~^~:;._,.;:~^~:;._,.;:
Alexandre Bergel
http://www.bergel.eu
^~:;._,.;:~^~:;._,.;:~^~:;._,.;:~^~:;._,.;:~^~:;.
On Jun 26, 2014, at 9:01 AM, Baptiste Quide
baptiste.quide@inria.fr wrote:
> Hi everyone,
>
> I'm working on a project in order to analyze automatically project source code. The project consists in analyzing automatically Smalltalk project source code and in visualizing all the dependencies among the packages.
> Currently i have only a UI (using Spec Framework) to visualize the results in a TreeModel. I would like to have a visualization, like the screenshot attached (done with Graphviz), using Roassal.
> As you can see, we have the packages (the nodes) and the edges are linking the packages when they have dependencies among them. I would like to have a graph-visualization in order to detect potential cyclic dependencies. How can i do that with Roassal?
> Thanks for your help.
>
> Baptiste
>
> <collections.pdf>_______________________________________________
> Moose-dev mailing list
> Moose-dev@iam.unibe.ch
>
https://www.iam.unibe.ch/mailman/listinfo/moose-dev
