
Hi!
Here is a post that describe how to have dates on the X-axis. This has been a recurrent problem, which is why I would like to share it with you.
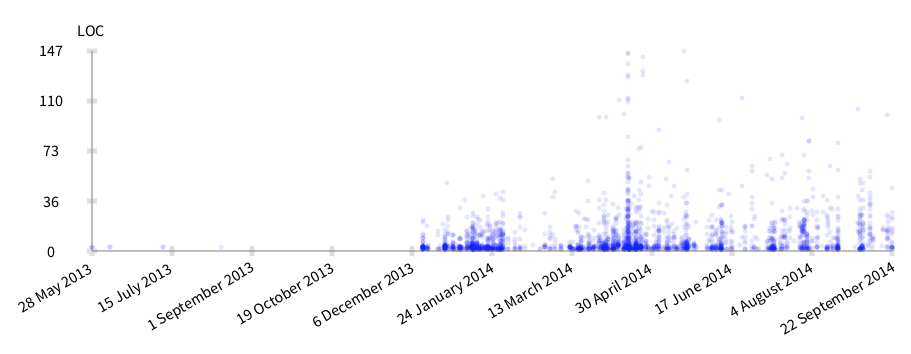
Dates are particular values that requires an adequate control over what is being displayed on X-axis. The julianDayNumber converts a date into a number.
-=-=-=-=-=-=-=-=-=-=-=-=-=-=-=-=-=-=-=-= methods := RTObject withAllSubclasses flatCollect: #methods. methods := methods reject: [ :m | m numberOfLinesOfCode > 150 ]. oldestMethod := methods minFor: #date.
b := RTCharterBuilder new. b extent: 800 @ 200. b shape circle size: 5; color: (Color blue alpha: 0.1). b interaction popup. b points: methods. b allY: #numberOfLinesOfCode. b allX: [ :m | m date julianDayNumber - oldestMethod date julianDayNumber ].
b axisConfiguration noDecimals; title: 'LOC'. b axisY. b axisConfiguration title: ''; labelRotation: -30; numberOfTicks: 10; numberOfLabels: 10; labelConvertion: [ :v | (Date julianDayNumber: v + oldestMethod date julianDayNumber) ]. b axisX.
b build -=-=-=-=-=-=-=-=-=-=-=-=-=-=-=-=-=-=-=-=
Cheers, Alexandre