
cool.
pls make sure the api stays stable.
e.g. changing convertion/conversion bit me hard with a DNU hours before release on my CI.
Maybe have a RTOldAPI package or something.
Phil Le 30 avr. 2015 20:00, "Alexandre Bergel" alexandre.bergel@me.com a écrit :
Hi!
We did a number of improvements of Grapher for Thomas. I am sharing them since some of you may find it relevant.
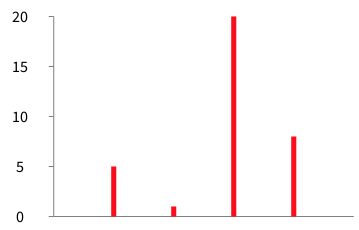
*** Tip: need to shift the Y-axis ***
b := RTGrapher new. ds := RTStackedDataSet new. ds barShape color: Color red. ds points: #(5 1 20 8). b add: ds. b axisX noLabel; noTick. b axisY noDecimal. b build.
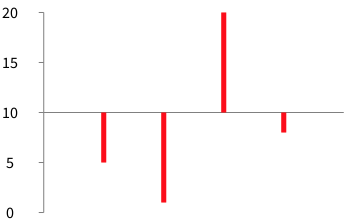
The Y-Axis can be shifted vertically using labelConversion: and a minor translation of the value, as in: b := RTGrapher new. ds := RTStackedDataSet new. ds barShape color: Color red. ds points: #(5 1 20 8). ds y: [ :v | v - 10 ]. b add: ds. b axisX noLabel; noTick. b axisY noDecimal. b axisY labelConversion: [ :v | v + 10 ]. b build.
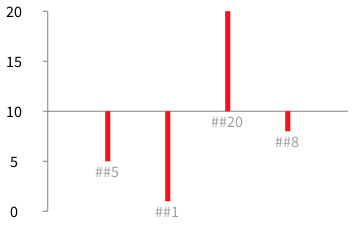
*** Improvement 1: Centered labels for bar charts ***
-=-=-=-=-=-=-=-=-=-=-=-= b := RTGrapher new. ds := RTStackedDataSet new. ds barShape color: Color red. ds points: #(5 1 20 8). ds y: [ :v | v - 10 ]. ds barChartWithBarCenteredTitle: [ :value | '##', value asString ]. b add: ds. b axisX noLabel; noTick. b axisY noDecimal. b axisY labelConversion: [ :v | v + 10 ]. b build. -=-=-=-=-=-=-=-=-=-=-=-=
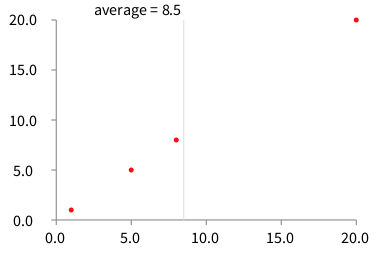
*** Improvement 2: Average for X values ***
b := RTGrapher new. ds := RTDataSet new. ds dotShape color: Color red. ds points: #(5 1 20 8). b add: ds. b addDecorator: (RTHorizontalAverageDecorator new withLabel; labelConvertion: [ :aValue | 'average = ', aValue asFloat asString ]). b build.
Cheers, Alexandre -- _,.;:~^~:;._,.;:~^~:;._,.;:~^~:;._,.;:~^~:;._,.;: Alexandre Bergel http://www.bergel.eu ^~:;._,.;:~^~:;._,.;:~^~:;._,.;:~^~:;._,.;:~^~:;.
Moose-dev mailing list Moose-dev@iam.unibe.ch https://www.iam.unibe.ch/mailman/listinfo/moose-dev