
19 Mar
2015
19 Mar
'15
10:48 p.m.
Hi!
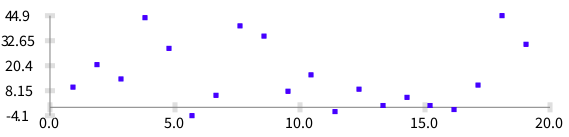
Milton did a wonderful improvement of Grapher. Consider the following expression: ((1 to: 20) collect: [ :v | 50 atRandom - 5.1 ]) plot
It produces:
As you can see, the horizontal bar is not in the 0 on the Y axis. And this is quite a problem actually. Excel does it much better. This is now fixed, in the last version of Roassal we have
Milton has implemented an optimization algorithm that identify the optimal minimum & maximum value on the axis, and the optimal number of ticks, to have a pleasant reading.
Enjoy!
Cheers, Alexandre
--
_,.;:~^~:;._,.;:~^~:;._,.;:~^~:;._,.;:~^~:;._,.;:
Alexandre Bergel http://www.bergel.eu
^~:;._,.;:~^~:;._,.;:~^~:;._,.;:~^~:;._,.;:~^~:;.