
Hi!
RTGraphBuilder went through major improvements. - min and max may be specified. - plugins to add some decoration (average line, standard deviation range, ticks lines, …)
Here are some examples, with some examples, which should illustrate these points:
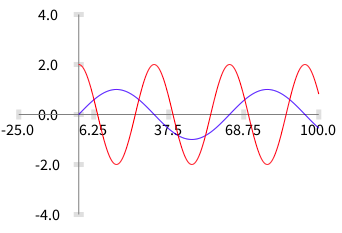
Is obtained with: -=-=-=-=-=-= -=-=-=-=-=-= -=-=-=-=-=-= -=-=-=-=-=-= -=-=-=-=-=-= | b ds | b := RTGrapherBuilder new.
ds := RTDataSet new. ds points: (0 to: 100 by: 0.1). ds y: [ :x | (0.1 * x) sin ]. ds noDot. ds interaction popupText: 'sinus'. ds connectColor: Color blue. b add: ds.
ds := RTDataSet new. ds points: (0 to: 100 by: 0.1). ds y: [ :x | (0.2 * x) cos * 2 ]. ds noDot. ds interaction popupText: 'cosinus'. ds connectColor: Color red. b add: ds.
b minY: -4. b maxY: 4. b minX: -25.
b build. -=-=-=-=-=-= -=-=-=-=-=-= -=-=-=-=-=-= -=-=-=-=-=-= -=-=-=-=-=-=
-=-=-=-=-=-= -=-=-=-=-=-= -=-=-=-=-=-= -=-=-=-=-=-= -=-=-=-=-=-=
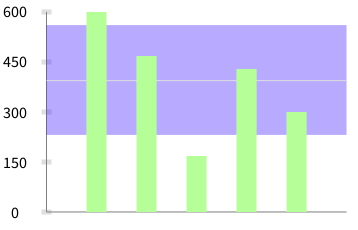
b := RTGrapherBuilder new.
ds := RTStackedDataSet new. ds interaction popup. ds points: #(600 470 170 430 300). ds barShape width: 20; color: Color lightGreen. b add: ds.
b axisX noLabel; noTick. b axisY noDecimals.
b addPlugin: RTMeanDevVarPlugin new. b build -=-=-=-=-=-= -=-=-=-=-=-= -=-=-=-=-=-= -=-=-=-=-=-= -=-=-=-=-=-=
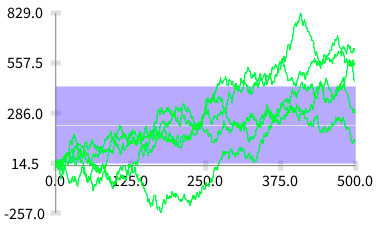
Another example:
-=-=-=-=-=-= -=-=-=-=-=-= -=-=-=-=-=-= -=-=-=-=-=-= -=-=-=-=-=-= b := RTGrapherBuilder new. b extent: 300 @ 200.
5 timesRepeat: [ ds := RTStackedDataSet new. ds noDot. ds points: ((1 to: 500) collect: [ :i | 50 atRandom - 25 ]) cumsum. ds connectColor: Color green. b add: ds. ].
b addPlugin: RTMeanDevVarPlugin new. b build. -=-=-=-=-=-= -=-=-=-=-=-= -=-=-=-=-=-= -=-=-=-=-=-= -=-=-=-=-=-=
The plugin framework exposes to a plugin all the necessary to define a whole range of decorations. For example, variable average lines, linear regression should be trivial to add...
Happy new year! Alexandre