
Hi. Here's how I'm using GanttChart - for process monitoring, I have some process that run throughout the day, and I like to be able to see back a bit how often the fail (or don't run) over the month. For this view, I group them up at the day period.
Here's the script (picture below):
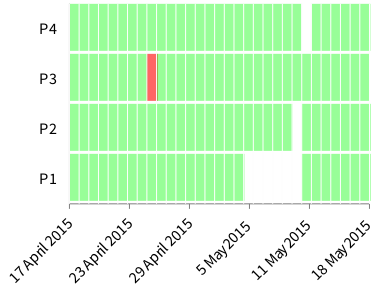
green := Color green alpha: 0.4. red := Color red alpha: 0.6. gray := Color gray alpha: 0.4. data := { { #good. 0. 18. #P1. green. }. { #good. 24. 31. #P1. green. }. { #good. 0. 23. #P2. green. }. {#good. 24. 31. #P2. green. }. { #good. 0. 8. #P3. green. }. { #failed. 8. 9. #P3. red. }. {#good. 9. 31. #P3. green. }. { #good. 0. 24. #P4. green. }. {#good. 25. 31. #P4. green. }. }.
b := RTTimeline new. s := RTTimelineSet new. s objects: data. s lineIdentifier: #fourth. s start: #second. s end: #third. s shape fillColor: #fifth. b add: s. b axisX numberOfLabels: 5; labelRotation: -45; labelConversion: [ :v | Date year: 2015 day: v + 107 ]. d := RTVerticalTickLineDecorator new. d shape line color: Color white. b axisX numberOfDecoratorTicks: 31. b addDecorator: d. b open.
[image: Inline image 1] Each veritcal bar is a day. Did this with changing RTVerticalTickLineDecorator to check for a different step than the label step - basically, caused the decorator to use a sub-tick number (using b axisX numberOfDecoratorTicks: 31 - new method added).
So, the request - is there a correct way to do this?
-cbc