
Hi!
We did a number of improvements of Grapher for Thomas. I am sharing them since some of you may find it relevant.
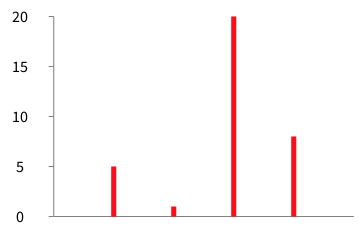
************************************** *** Tip: need to shift the Y-axis ***
b := RTGrapher new. ds := RTStackedDataSet new. ds barShape color: Color red. ds points: #(5 1 20 8). b add: ds. b axisX noLabel; noTick. b axisY noDecimal. b build.
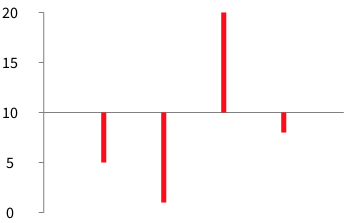
The Y-Axis can be shifted vertically using labelConversion: and a minor translation of the value, as in: b := RTGrapher new. ds := RTStackedDataSet new. ds barShape color: Color red. ds points: #(5 1 20 8). ds y: [ :v | v - 10 ]. b add: ds. b axisX noLabel; noTick. b axisY noDecimal. b axisY labelConversion: [ :v | v + 10 ]. b build.
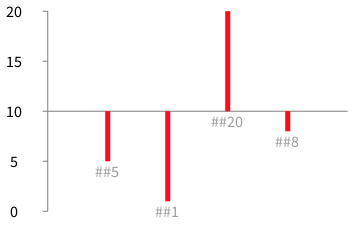
************************************** *** Improvement 1: Centered labels for bar charts ***
-=-=-=-=-=-=-=-=-=-=-=-= b := RTGrapher new. ds := RTStackedDataSet new. ds barShape color: Color red. ds points: #(5 1 20 8). ds y: [ :v | v - 10 ]. ds barChartWithBarCenteredTitle: [ :value | '##', value asString ]. b add: ds. b axisX noLabel; noTick. b axisY noDecimal. b axisY labelConversion: [ :v | v + 10 ]. b build. -=-=-=-=-=-=-=-=-=-=-=-=
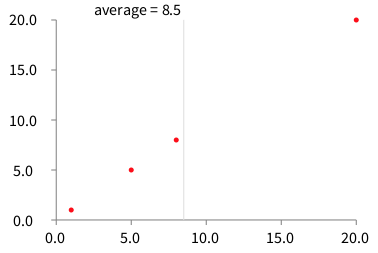
************************************** *** Improvement 2: Average for X values ***
b := RTGrapher new. ds := RTDataSet new. ds dotShape color: Color red. ds points: #(5 1 20 8). b add: ds. b addDecorator: (RTHorizontalAverageDecorator new withLabel; labelConvertion: [ :aValue | 'average = ', aValue asFloat asString ]). b build.
Cheers, Alexandre