
Hi Alex,
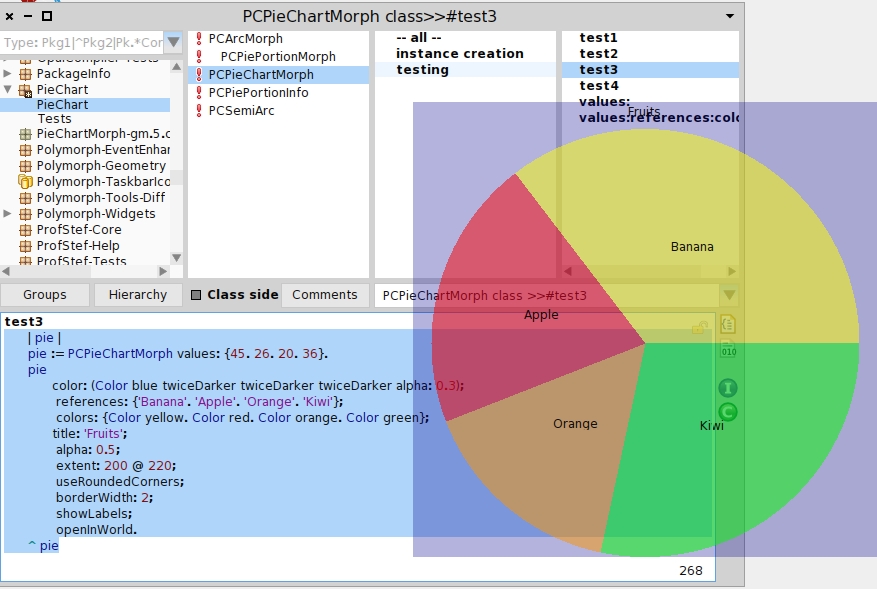
Maybe I was not clear enough, I didn't meant to say I will write a Pie chart :) I have just tried to add labels to GraphET2 but finally I have ported the PieChartMorph to Pharo 3 and looks good (see attachment) even almost all tests passed: 49 run, 48 passes, 0 skipped, 0 expected failures, 0 failures, 1 errors, 0 unexpected passes.
PieChartMorph is completely independent of GraphET2, here is status info and credits: http://wiki.squeak.org/squeak/2624
Hernán
2014-07-31 20:09 GMT-03:00 Alexandre Bergel alexandre.bergel@me.com:
Hi Hernan,
What is the status of your Pie chart ? Is it kept separated from GraphET2?
Alexandre
On Jul 28, 2014, at 6:29 PM, Hernán Morales Durand < hernan.morales@gmail.com> wrote:
Thanks Alex,
I did not finished reading the chapter about RTBuilder yet. But
regardless of the GraphET2 scope, having a pie diagram builder is important for Pharo (I don't know the status of PieChartMorph but I will check).
I have tried two different directions. One is adding a RTLabel to each
sector shape in #getElementsFromModels
GET2PieDiagram>>getElementsFromModels
... label := RTLabel new text: model key. shape := shape + label. ...
| diag | diag := GET2DiagramBuilder new. (diag pieDiagram) function: #value; models: {'A' -> 30 . 'B' -> 10 . 'C' -> 20 . 'D' -> 40}; color: [ Color random ]. ^ diag open.
Another one is using #modelLabels: to add labels to axis:
| diag | diag := GET2DiagramBuilder new. (diag pieDiagram) modelLabels: #key; function: #value; models: {'A' -> 30 . 'B' -> 10 . 'C' -> 20 . 'D' -> 40}; color: [ Color random ]. ^ diag open.
but none of them positions the labels nicely. If anyone wants to comment
would be very welcome :)
Cheers,
Hernán
2014-07-26 14:14 GMT-03:00 Alexandre Bergel alexandre.bergel@me.com: Hi Hernán,
Thanks for your effort. This is very valuable. However, I am not sure a pie diagram should be part of GraphET. A pie is
radically different from a curve. Maybe subclassing the class RTBuilder is the way to go. You will then not be constraint by GraphET for the labeling...
Cheers, Alexandre
On Jul 25, 2014, at 8:41 PM, Hernán Morales Durand <
hernan.morales@gmail.com> wrote:
Hello
I am trying GET2 pieDiagram builder. You may want to add a random
color in the #pieExample method so it looks nicer (see attachment):
| diag | diag := GET2DiagramBuilder new. (diag pieDiagram) models: #(30 10 20 40); color: [ Color random ]. ^ diag open.
Now my question is simple, but I don't know how to start
How would you add labels to each sector?
Hernán
<PieChart_1.png>_______________________________________________ Moose-dev mailing list Moose-dev@iam.unibe.ch https://www.iam.unibe.ch/mailman/listinfo/moose-dev
-- _,.;:~^~:;._,.;:~^~:;._,.;:~^~:;._,.;:~^~:;._,.;: Alexandre Bergel http://www.bergel.eu ^~:;._,.;:~^~:;._,.;:~^~:;._,.;:~^~:;._,.;:~^~:;.
Moose-dev mailing list Moose-dev@iam.unibe.ch https://www.iam.unibe.ch/mailman/listinfo/moose-dev
Moose-dev mailing list Moose-dev@iam.unibe.ch https://www.iam.unibe.ch/mailman/listinfo/moose-dev
-- _,.;:~^~:;._,.;:~^~:;._,.;:~^~:;._,.;:~^~:;._,.;: Alexandre Bergel http://www.bergel.eu ^~:;._,.;:~^~:;._,.;:~^~:;._,.;:~^~:;._,.;:~^~:;.
Moose-dev mailing list Moose-dev@iam.unibe.ch https://www.iam.unibe.ch/mailman/listinfo/moose-dev