
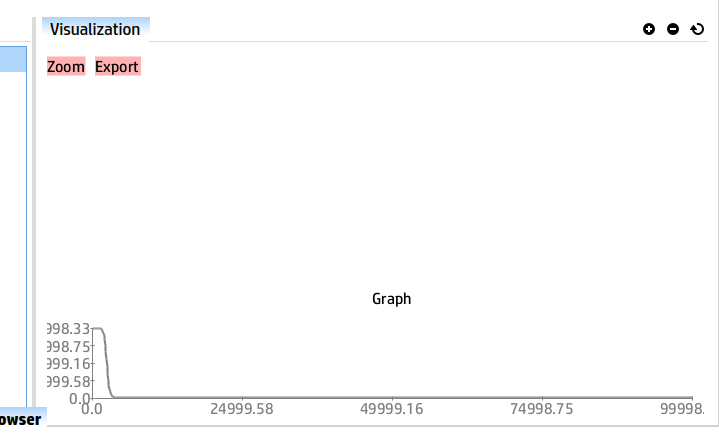
Hi, I added the height and the width but this not resolve the problem. I got for height 70 the first screen shot and for 140 the second. The problem is that when i increase the height, part of graph hidden and i must to zoom. How can i center the graph in the middle of panel?
thanks
2014-05-19 23:39 GMT+07:00 moose-dev-request@iam.unibe.ch:
Send Moose-dev mailing list submissions to moose-dev@iam.unibe.ch
To subscribe or unsubscribe via the World Wide Web, visit https://www.iam.unibe.ch/mailman/listinfo/moose-dev or, via email, send a message with subject or body 'help' to moose-dev-request@iam.unibe.ch
You can reach the person managing the list at moose-dev-owner@iam.unibe.ch
When replying, please edit your Subject line so it is more specific than "Re: Contents of Moose-dev digest..."
Today's Topics:
- Jenkins build is back to stable : moose-5.0 #1424 (admin@moosetechnology.org)
- Re: please stop using strings :) (Alexandre Bergel)
- Re: view of graph in glamour (Alexandre Bergel)
Message: 1 Date: Mon, 19 May 2014 15:55:39 +0200 (CEST) From: admin@moosetechnology.org Subject: [Moose-dev] Jenkins build is back to stable : moose-5.0 #1424 To: moose-dev@iam.unibe.ch Message-ID: < 718878653.102.1400507739022.JavaMail.jenk_moose@ci-jenkins3.inria.fr> Content-Type: text/plain; charset=UTF-8
See https://ci.inria.fr/moose/job/moose-5.0/1424/
Message: 2 Date: Mon, 19 May 2014 12:33:45 -0400 From: Alexandre Bergel alexandre.bergel@me.com Subject: [Moose-dev] Re: please stop using strings :) To: Moose-related development moose-dev@iam.unibe.ch Message-ID: 0A1C5508-3DDD-4DED-80AA-303F661A3E9A@me.com Content-Type: text/plain; CHARSET=US-ASCII
I perfectly agree. I think Pablo did this because of an algorithm he found and copied it. Untangling the whole thing is relatively straight forward. The starting point is to look at the implementation of #rawPalette in the subclasses of ColorPalette.
I will put this on our todo list.
Alexandre
_,.;:~^~:;._,.;:~^~:;._,.;:~^~:;._,.;:~^~:;._,.;: Alexandre Bergel http://www.bergel.eu ^~:;._,.;:~^~:;._,.;:~^~:;._,.;:~^~:;._,.;:~^~:;.
On May 18, 2014, at 8:46 AM, Tudor Girba tudor@tudorgirba.com wrote:
Hi,
The ColorPalette in Roassal2 is quite cool, but we should refactor the
code to not rely on strings.
An example: |n elements view| n := RTBucketColor numberOfColors: 5 command: #asInteger scope:
($a to: $z).
  n colorScheme: 'Blues'.
  elements := (RTBox new size: 20; color: n) elementsOn: ($a to: $z).
  view := RTView new.
  view addAll: elements.
  RTGridLayout on: view elements.
  view open.
'Blues' is actually an identifier that is looked up in all the
rawPalette keys returned by the subclasses of ColorPalette.
This is not nice. We should have for each palette a method with the same
name, and the colorScheme: should work with an object like:
n colorScheme: CPSequential blues
Do we agree on this?
Doru
-- www.tudorgirba.com
"Every thing has its own flow" _______________________________________________ Moose-dev mailing list Moose-dev@iam.unibe.ch https://www.iam.unibe.ch/mailman/listinfo/moose-dev
Message: 3 Date: Mon, 19 May 2014 12:39:18 -0400 From: Alexandre Bergel alexandre.bergel@me.com Subject: [Moose-dev] Re: view of graph in glamour To: Moose-related development moose-dev@iam.unibe.ch Message-ID: E26A3FFE-2275-412D-BAD1-ABCBF6600212@me.com Content-Type: text/plain; charset="iso-8859-1"
You can use #height: and #width: to a builder to set a particular size. Try this:
-=-=-=-=-=-=-=-=-=-=-=-=-=-=-= | builder normalizer data | data := (1 to: 100) collect: [ :i | Array with: i with: 20 atRandom + 30 ].
    normalizer := RTNColorLinearNormalizer
                                    inContext: data withCommand:
#second lowColor: Color paleRed highColor: Color blue.
    builder := GET2Line data: data.
    builder
            x: #first;
            y: #second;
            lineWidth: 2;
            dotColor: [ :v |  (normalizer rtValue: v) alpha: 0.5];
            dotSize: 15;
            height: 100;
            width: 150.
builder build. builder view -=-=-=-=-=-=-=-=-=-=-=-=-=-=-=
Without specifying height: and width: gives you something like:
-- _,.;:~^~:;._,.;:~^~:;._,.;:~^~:;._,.;:~^~:;._,.;: Alexandre Bergel http://www.bergel.eu ^~:;._,.;:~^~:;._,.;:~^~:;._,.;:~^~:;._,.;:~^~:;.
On May 19, 2014, at 4:42 AM, Fabrice Atrevi atrevifabrice@gmail.com wrote:
hi, i build a graph in glamour. But, when i run my browser, the graph not be
at the center of the panel (like in the screen shot) and there are not the scroll bar for view properly. Also, i want to label the axis, how can i do it?
thanks!
ATREVI D. Fabrice Master en Informatique A l'Institut de la Francophonie pour
l'Informatique (IFI/Hano?)
<pb_barre_deroulant.PNG>_______________________________________________ Moose-dev mailing list Moose-dev@iam.unibe.ch https://www.iam.unibe.ch/mailman/listinfo/moose-dev