
Hi Mr Alexandre! It's ok now. I use RTCharterBuilder in my browser with Glamour. :) I have another preoccupation. I want to know, if it's possible to hide a box in Roassal2. Indeed, I want to draw one box and one edge. The edge will come from the box and will haven't the end box. I think, i can draw two box and a edge between its, and hide the end box box.
Thanks a lot!
2014-09-19 15:49 GMT+01:00 moose-dev-request@iam.unibe.ch:
Send Moose-dev mailing list submissions to moose-dev@iam.unibe.ch
To subscribe or unsubscribe via the World Wide Web, visit https://www.iam.unibe.ch/mailman/listinfo/moose-dev or, via email, send a message with subject or body 'help' to moose-dev-request@iam.unibe.ch
You can reach the person managing the list at moose-dev-owner@iam.unibe.ch
When replying, please edit your Subject line so it is more specific than "Re: Contents of Moose-dev digest..."
Today's Topics:
- Re: bug with GET2Line in graphET2 (Alexandre Bergel)
Message: 1 Date: Fri, 19 Sep 2014 07:48:56 -0700 From: Alexandre Bergel alexandre.bergel@me.com Subject: [Moose-dev] Re: bug with GET2Line in graphET2 To: Moose-related development moose-dev@iam.unibe.ch Message-ID: DEED1CB6-FBB8-4CB5-A622-4AD99FD00149@me.com Content-Type: text/plain; charset="iso-8859-1"
Hi Fabrice,
We have known this bug for quite some time. Actually, this is this bug which has motivated us to start Charter.
I suggest you to complete drop GraphET2 and focus on Charter. Here is an example: -=-=-=-=-=-=-=-=-=-=-=-=-=-=-=-=-=-=-=-= b := RTCharterBuilder new. b extent: 300 @ 300. b shape rectangle size: 0. b points: (0 to: 100). b allY: [ :x | x * x ]. b allX: #yourself. b connectDotColor: Color gray. b axisXTitled: 'X'; axisYTitled: 'Y'. b build -=-=-=-=-=-=-=-=-=-=-=-=-=-=-=-=-=-=-=-=
It produces the following:
Let us know how we can help you to migrate your code from GraphET2 to Charter.
Cheers, Alexandre
On Sep 19, 2014, at 6:24 AM, Fabrice Atrevi atrevifabrice@gmail.com wrote:
Hi, I face a bug in the labelling of x-axis with GET2Line in graphET2. For
example, with this code:
  | builder |
  builder := GET2Line data: (0 to: 100).
  builder
          y: [ :x | x*x ];
          dotSize: 10.

  builder open
I got the first screenshot.
With another example, i note that, the X-Axis take the right value, but
the label is not correct.
| bg| data class== KETimeSeries ifTrue:[ bg := GET2Line new view: each; data: (data index). bg x: [:e | (data index) at: e]; y: [ :x | data at: x]; title:'Graph of compartment ' ,(donne keyAtValue: data); lineWidth: 2; height: 200; width: 500. bg interaction popupText. bg build.
The second screenshot show that, when i point the value "24.35" on the
x-axis, i get "50" because i use "interaction popupText".
The third screenshot show what i got with another builder.
Remark: i have integrated GET2Line in a browser with Glamour.
Thanks
-- ATREVI D. Fabrice Master en Informatique A l'Institut de la Francophonie pour
l'Informatique (IFI/Hano?)
<cap1.PNG><cap2.png><cap3.png>_______________________________________________
Moose-dev mailing list Moose-dev@iam.unibe.ch https://www.iam.unibe.ch/mailman/listinfo/moose-dev
-- _,.;:~^~:;._,.;:~^~:;._,.;:~^~:;._,.;:~^~:;._,.;: Alexandre Bergel http://www.bergel.eu ^~:;._,.;:~^~:;._,.;:~^~:;._,.;:~^~:;._,.;:~^~:;.

It's ok now. I use RTCharterBuilder in my browser with Glamour. :)
Ok, let me know how it goes!
I have another preoccupation. I want to know, if it's possible to hide a box in Roassal2. Indeed, I want to draw one box and one edge. The edge will come from the box and will haven't the end box. I think, i can draw two box and a edge between its, and hide the end box box.
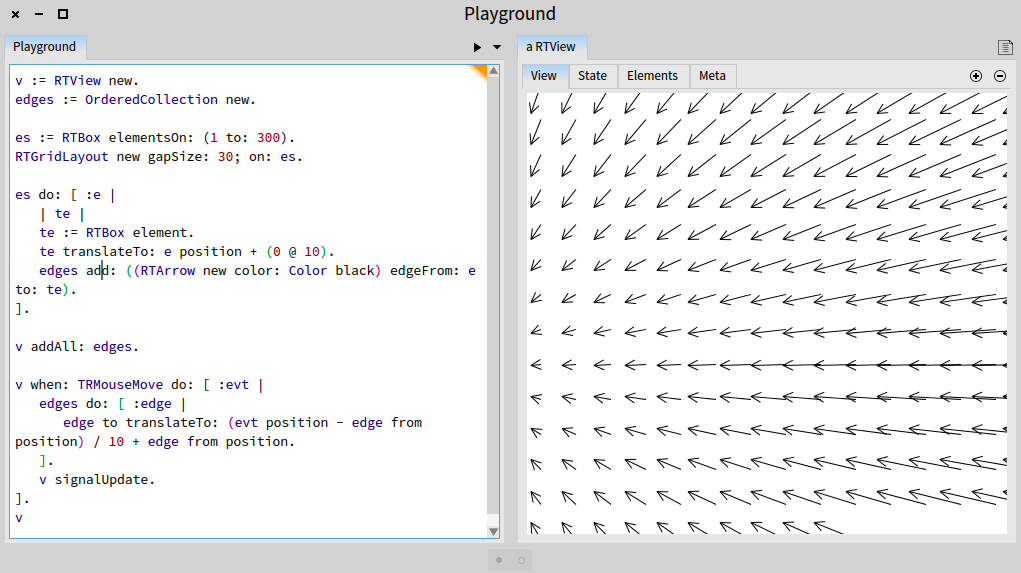
Sure! You do not have to add the from and to element to the view. You can simply add the edge. Consider the example, with a nice animation:
-=-=-=-=-=-=-=-=-=-=-=-=-=-=-=-=-=-= v := RTView new. edges := OrderedCollection new.
es := RTBox elementsOn: (1 to: 300). RTGridLayout new gapSize: 30; on: es.
es do: [ :e | | te | te := RTBox element. te translateTo: e position + (0 @ 10). edges add: ((RTArrow new color: Color black) edgeFrom: e to: te). ].
v addAll: edges.
v when: TRMouseMove do: [ :evt | edges do: [ :edge | edge to translateTo: (evt position - edge from position) / 10 + edge from position. ]. v signalUpdate. ]. v -=-=-=-=-=-=-=-=-=-=-=-=-=-=-=-=-=-=
All the arrows moves when the mouse move. The extremities of each arrow is not in the view.
I have made a post on https://www.facebook.com/ObjectProfile/photos/a.341189379300999.82969.340543...
Cheers, Alexandre
2014-09-19 15:49 GMT+01:00 moose-dev-request@iam.unibe.ch: Send Moose-dev mailing list submissions to moose-dev@iam.unibe.ch
To subscribe or unsubscribe via the World Wide Web, visit https://www.iam.unibe.ch/mailman/listinfo/moose-dev or, via email, send a message with subject or body 'help' to moose-dev-request@iam.unibe.ch
You can reach the person managing the list at moose-dev-owner@iam.unibe.ch
When replying, please edit your Subject line so it is more specific than "Re: Contents of Moose-dev digest..."
Today's Topics:
- Re: bug with GET2Line in graphET2 (Alexandre Bergel)
Message: 1 Date: Fri, 19 Sep 2014 07:48:56 -0700 From: Alexandre Bergel alexandre.bergel@me.com Subject: [Moose-dev] Re: bug with GET2Line in graphET2 To: Moose-related development moose-dev@iam.unibe.ch Message-ID: DEED1CB6-FBB8-4CB5-A622-4AD99FD00149@me.com Content-Type: text/plain; charset="iso-8859-1"
Hi Fabrice,
We have known this bug for quite some time. Actually, this is this bug which has motivated us to start Charter.
I suggest you to complete drop GraphET2 and focus on Charter. Here is an example:
b := RTCharterBuilder new. b extent: 300 @ 300. b shape rectangle size: 0. b points: (0 to: 100). b allY: [ :x | x * x ]. b allX: #yourself. b connectDotColor: Color gray. b axisXTitled: 'X'; axisYTitled: 'Y'. b build -=-=-=-=-=-=-=-=-=-=-=-=-=-=-=-=-=-=-=-=
It produces the following:
Let us know how we can help you to migrate your code from GraphET2 to Charter.
Cheers, Alexandre
On Sep 19, 2014, at 6:24 AM, Fabrice Atrevi atrevifabrice@gmail.com wrote:
Hi, I face a bug in the labelling of x-axis with GET2Line in graphET2. For example, with this code:
  | builder |
  builder := GET2Line data: (0 to: 100).
  builder
          y: [ :x | x*x ];
          dotSize: 10.

  builder open
I got the first screenshot.
With another example, i note that, the X-Axis take the right value, but the label is not correct.
| bg| data class== KETimeSeries ifTrue:[ bg := GET2Line new view: each; data: (data index). bg x: [:e | (data index) at: e]; y: [ :x | data at: x]; title:'Graph of compartment ' ,(donne keyAtValue: data); lineWidth: 2; height: 200; width: 500. bg interaction popupText. bg build.
The second screenshot show that, when i point the value "24.35" on the x-axis, i get "50" because i use "interaction popupText". The third screenshot show what i got with another builder.
Remark: i have integrated GET2Line in a browser with Glamour.
Thanks
-- ATREVI D. Fabrice Master en Informatique A l'Institut de la Francophonie pour l'Informatique (IFI/Hano?) <cap1.PNG><cap2.png><cap3.png>_______________________________________________ Moose-dev mailing list Moose-dev@iam.unibe.ch https://www.iam.unibe.ch/mailman/listinfo/moose-dev
-- _,.;:~^~:;._,.;:~^~:;._,.;:~^~:;._,.;:~^~:;._,.;: Alexandre Bergel http://www.bergel.eu ^~:;._,.;:~^~:;._,.;:~^~:;._,.;:~^~:;._,.;:~^~:;.
-
 Alexandre Bergel
 -
 Fabrice Atrevi