
Hi!
I relaxed a bit by implementing something that was missing in Grapher.
Consider the following code: -=-=-=-=-=-=-=-=-=-=-=-= b := RTGrapher new.
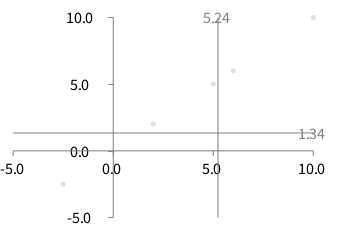
ds := RTDataSet new. ds points: #(5 10 6 2 -2.5). b add: ds.
“below is the magic line" b addDecorator: RTCursorFollower new. b -=-=-=-=-=-=-=-=-=-=-=-=
This “magic line” add two bar that follows the mouse cursor. Here is a screenshot:
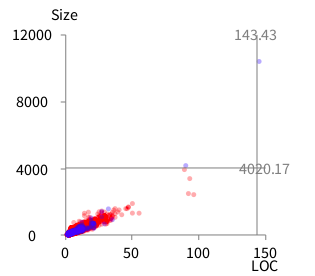
Here is on a larger example: -=-=-=-=-=-=-=-=-=-=-=-=-=-=-=-=-=-=-=-= | methods trachelMethods b ds | methods := Collection withAllSubclasses flatCollect: #rtmethods. trachelMethods := TRObject withAllSubclasses flatCollect: #rtmethods.
b := RTGrapher new. b extent: 200 @ 200.
"Data set 1" ds := RTDataSet new. ds interaction popup. ds dotShape circle color: (Color red alpha: 0.3). ds points: methods. ds x: #numberOfLinesOfCode. ds y: [ :m | m getSource size ]. b add: ds.
"Data set 2" ds := RTDataSet new. ds interaction popup. ds dotShape circle color: (Color blue alpha: 0.3). ds points: trachelMethods. ds x: #numberOfLinesOfCode. ds y: [ :m | m getSource size ]. b add: ds.
b axisX withThousandsSeparator; title: 'LOC'. b axisY noDecimal; title: 'Size'. b addDecorator: RTCursorFollower new. b build.
^ b view -=-=-=-=-=-=-=-=-=-=-=-=-=-=-=-=-=-=-=-=
Maybe this cursor follower should be per default in all produced chart. Any opinion?
Cheers, Alexandre

Looks very cool ! I would turn it on by default.
On May 20, 2015, at 12:33, Alexandre Bergel alexandre.bergel@me.com wrote:
Hi!
I relaxed a bit by implementing something that was missing in Grapher.
Consider the following code:
b := RTGrapher new.
ds := RTDataSet new. ds points: #(5 10 6 2 -2.5). b add: ds.
“below is the magic line" b addDecorator: RTCursorFollower new. b -=-=-=-=-=-=-=-=-=-=-=-=
This “magic line” add two bar that follows the mouse cursor. Here is a screenshot: <Screen Shot 2015-05-20 at 11.30.02 AM.png>
Here is on a larger example:
| methods trachelMethods b ds | methods := Collection withAllSubclasses flatCollect: #rtmethods. trachelMethods := TRObject withAllSubclasses flatCollect: #rtmethods.
b := RTGrapher new. b extent: 200 @ 200.
"Data set 1" ds := RTDataSet new. ds interaction popup. ds dotShape circle color: (Color red alpha: 0.3). ds points: methods. ds x: #numberOfLinesOfCode. ds y: [ :m | m getSource size ]. b add: ds.
"Data set 2" ds := RTDataSet new. ds interaction popup. ds dotShape circle color: (Color blue alpha: 0.3). ds points: trachelMethods. ds x: #numberOfLinesOfCode. ds y: [ :m | m getSource size ]. b add: ds.
b axisX withThousandsSeparator; title: 'LOC'. b axisY noDecimal; title: 'Size'.
b addDecorator: RTCursorFollower new. b build.
^ b view
<Screen Shot 2015-05-20 at 11.31.03 AM.png>
Maybe this cursor follower should be per default in all produced chart. Any opinion?
Cheers, Alexandre -- _,.;:~^~:;._,.;:~^~:;._,.;:~^~:;._,.;:~^~:;._,.;: Alexandre Bergel http://www.bergel.eu http://www.bergel.eu/ ^~:;._,.;:~^~:;._,.;:~^~:;._,.;:~^~:;._,.;:~^~:;.
Moose-dev mailing list Moose-dev@iam.unibe.ch https://www.iam.unibe.ch/mailman/listinfo/moose-dev
---> Save our in-boxes! http://emailcharter.org <---
Johan Fabry - http://pleiad.cl/~jfabry PLEIAD lab - Computer Science Department (DCC) - University of Chile

+1 to Johan. Seems a pretty good default.
Offray
El 20/05/15 a las 09:49, Johan Fabry escribió:
Looks very cool ! I would turn it on by default.
On May 20, 2015, at 12:33, Alexandre Bergel <alexandre.bergel@me.com mailto:alexandre.bergel@me.com> wrote:
Hi!
I relaxed a bit by implementing something that was missing in Grapher.
Consider the following code:
b := RTGrapher new.
ds := RTDataSet new. ds points: #(5 10 6 2 -2.5). b add: ds.
“below is the magic line" b addDecorator: RTCursorFollower new. b -=-=-=-=-=-=-=-=-=-=-=-=
This “magic line” add two bar that follows the mouse cursor. Here is a screenshot: <Screen Shot 2015-05-20 at 11.30.02 AM.png>
Here is on a larger example:
| methods trachelMethods b ds | methods := Collection withAllSubclasses flatCollect: #rtmethods. trachelMethods := TRObject withAllSubclasses flatCollect: #rtmethods.
b := RTGrapher new. b extent: 200 @ 200.
"Data set 1" ds := RTDataSet new. ds interaction popup. ds dotShape circle color: (Color red alpha: 0.3). ds points: methods. ds x: #numberOfLinesOfCode. ds y: [ :m | m getSource size ]. b add: ds.
"Data set 2" ds := RTDataSet new. ds interaction popup. ds dotShape circle color: (Color blue alpha: 0.3). ds points: trachelMethods. ds x: #numberOfLinesOfCode. ds y: [ :m | m getSource size ]. b add: ds.
b axisX withThousandsSeparator; title: 'LOC'. b axisY noDecimal; title: 'Size'.
b addDecorator: RTCursorFollower new. b build.
^ b view
<Screen Shot 2015-05-20 at 11.31.03 AM.png>
Maybe this cursor follower should be per default in all produced chart. Any opinion?
Cheers, Alexandre -- _,.;:~^~:;._,.;:~^~:;._,.;:~^~:;._,.;:~^~:;._,.;: Alexandre Bergel http://www.bergel.eu http://www.bergel.eu/ ^~:;._,.;:~^~:;._,.;:~^~:;._,.;:~^~:;._,.;:~^~:;.
Moose-dev mailing list Moose-dev@iam.unibe.ch mailto:Moose-dev@iam.unibe.ch https://www.iam.unibe.ch/mailman/listinfo/moose-dev
---> Save our in-boxes! http://emailcharter.org <---
Johan Fabry - http://pleiad.cl/~jfabry PLEIAD lab - Computer Science Department (DCC) - University of Chile
Moose-dev mailing list Moose-dev@iam.unibe.ch https://www.iam.unibe.ch/mailman/listinfo/moose-dev
hi!
At the end, I prefer to not have it as default. I added a short section (Section 5.1) about this decorator in
https://dl.dropboxusercontent.com/u/31543901/AgileVisualization/Grapher/0203...
Cheers, Alexandre
On May 23, 2015, at 1:58 PM, Offray Vladimir Luna Cárdenas offray@riseup.net wrote:
+1 to Johan. Seems a pretty good default.
Offray
El 20/05/15 a las 09:49, Johan Fabry escribió:
Looks very cool ! I would turn it on by default.
On May 20, 2015, at 12:33, Alexandre Bergel <alexandre.bergel@me.com mailto:alexandre.bergel@me.com> wrote:
Hi!
I relaxed a bit by implementing something that was missing in Grapher.
Consider the following code:
b := RTGrapher new.
ds := RTDataSet new. ds points: #(5 10 6 2 -2.5). b add: ds.
“below is the magic line" b addDecorator: RTCursorFollower new. b -=-=-=-=-=-=-=-=-=-=-=-=
This “magic line” add two bar that follows the mouse cursor. Here is a screenshot: <Screen Shot 2015-05-20 at 11.30.02 AM.png>
Here is on a larger example:
| methods trachelMethods b ds | methods := Collection withAllSubclasses flatCollect: #rtmethods. trachelMethods := TRObject withAllSubclasses flatCollect: #rtmethods.
b := RTGrapher new. b extent: 200 @ 200.
"Data set 1" ds := RTDataSet new. ds interaction popup. ds dotShape circle color: (Color red alpha: 0.3). ds points: methods. ds x: #numberOfLinesOfCode. ds y: [ :m | m getSource size ]. b add: ds.
"Data set 2" ds := RTDataSet new. ds interaction popup. ds dotShape circle color: (Color blue alpha: 0.3). ds points: trachelMethods. ds x: #numberOfLinesOfCode. ds y: [ :m | m getSource size ]. b add: ds.
b axisX withThousandsSeparator; title: 'LOC'. b axisY noDecimal; title: 'Size'.
b addDecorator: RTCursorFollower new. b build.
^ b view
<Screen Shot 2015-05-20 at 11.31.03 AM.png>
Maybe this cursor follower should be per default in all produced chart. Any opinion?
Cheers, Alexandre -- _,.;:~^~:;._,.;:~^~:;._,.;:~^~:;._,.;:~^~:;._,.;: Alexandre Bergel http://www.bergel.eu http://www.bergel.eu/ ^~:;._,.;:~^~:;._,.;:~^~:;._,.;:~^~:;._,.;:~^~:;.
Moose-dev mailing list Moose-dev@iam.unibe.ch mailto:Moose-dev@iam.unibe.ch https://www.iam.unibe.ch/mailman/listinfo/moose-dev
---> Save our in-boxes! http://emailcharter.org <---
Johan Fabry - http://pleiad.cl/~jfabry PLEIAD lab - Computer Science Department (DCC) - University of Chile
Moose-dev mailing list Moose-dev@iam.unibe.ch https://www.iam.unibe.ch/mailman/listinfo/moose-dev
Moose-dev mailing list Moose-dev@iam.unibe.ch https://www.iam.unibe.ch/mailman/listinfo/moose-dev
-
 Alexandre Bergel
 -
 Johan Fabry
 -
 Offray Vladimir Luna Cárdenas