
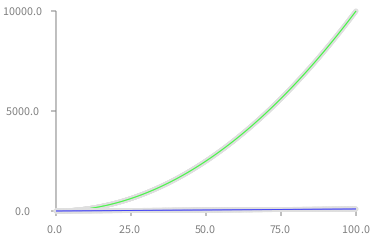
The attached capture is the one implemented by the method #exampledoubleCurves.
If you zoom the image you will notice the grey edge of each green and blue line. The same happens in #exampleVerticalAndHorizontalLines
Is there a way to remove it the grey around each line?
Cheers,
Hernán

Hi Hernán,
The attached capture is the one implemented by the method #exampledoubleCurves.
If you zoom the image you will notice the grey edge of each green and blue line. The same happens in #exampleVerticalAndHorizontalLines
Is there a way to remove it the grey around each line?
The grey outline are actually the dots.
You need to write “ds noDot” before calling “points:” Here is an example:
| b ds | b := RTGrapher new.
b extent: 300 @ 200.
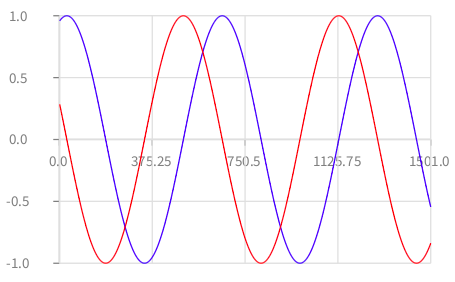
ds := RTData new. ds noDot. ds points: (-50 to: 100 by: 0.1). ds y: [ :x | (0.1 * x) sin ]. ds noDot. ds interaction popupText: 'sinus'. ds connectColor: Color blue. b add: ds.
ds := RTData new. ds noDot. ds points: (-50 to: 100 by: 0.1). ds y: [ :x | (0.1 * x) cos ]. ds noDot. ds interaction popupText: 'cosinus'. ds connectColor: Color red. b add: ds.
b addDecorator: RTHorizontalTickLineDecorator new. b addDecorator: RTVerticalTickLineDecorator new.
^ b Which produces:
I have updated these example. Indeed, there is no good reason of having the dots.
Alexandre
Cheers,
Hernán
<grey_line.png>_______________________________________________ Moose-dev mailing list Moose-dev@list.inf.unibe.ch https://www.list.inf.unibe.ch/listinfo/moose-dev
Hi Alex,
Thank you for your help on this. Though I still don't get why there are dots behind the lines by default? Any particular reason?
Cheers
Hernán
2017-02-17 19:46 GMT-03:00 Alexandre Bergel alexandre.bergel@me.com:
Hi Hernán,
The attached capture is the one implemented by the method #exampledoubleCurves.
If you zoom the image you will notice the grey edge of each green and blue line. The same happens in #exampleVerticalAndHorizontalLines
Is there a way to remove it the grey around each line?
The grey outline are actually the dots.
You need to write “ds noDot” before calling “points:” Here is an example:
| b ds | b := RTGrapher new.
b extent: 300 @ 200.
ds := RTData new. ds noDot. ds points: (-50 to: 100 by: 0.1). ds y: [ :x | (0.1 * x) sin ]. ds noDot. ds interaction popupText: 'sinus'. ds connectColor: Color blue. b add: ds.
ds := RTData new. ds noDot. ds points: (-50 to: 100 by: 0.1). ds y: [ :x | (0.1 * x) cos ]. ds noDot. ds interaction popupText: 'cosinus'. ds connectColor: Color red. b add: ds.
b addDecorator: RTHorizontalTickLineDecorator new. b addDecorator: RTVerticalTickLineDecorator new.
^ b Which produces:
I have updated these example. Indeed, there is no good reason of having the dots.
Alexandre
Cheers,
Hernán
<grey_line.png>_______________________________________________ Moose-dev mailing list Moose-dev@list.inf.unibe.ch https://www.list.inf.unibe.ch/listinfo/moose-dev
-- _,.;:~^~:;._,.;:~^~:;._,.;:~^~:;._,.;:~^~:;._,.;: Alexandre Bergel http://www.bergel.eu ^~:;._,.;:~^~:;._,.;:~^~:;._,.;:~^~:;._,.;:~^~:;.
Moose-dev mailing list Moose-dev@list.inf.unibe.ch https://www.list.inf.unibe.ch/listinfo/moose-dev
Thank you for your help on this.
No problem!
Though I still don't get why there are dots behind the lines by default? Any particular reason?
There is no particular reason. I have never questioned this since it is rare when I use both dots and lines. One reason against having the dots in front of the lines is the reduced accuracy of the data point representation. Having the line in front of the dot is more accurate. But this is something that should be configurable. Update Roassal and you will have it. Here is an example:
-=-=-=-=-=-= b := RTGrapher new. ds := RTData new. ds dotShape color: Color red; size: 10. ds points: (Collection withAllSubclasses copyFrom: 1 to: 10). ds y: #numberOfMethods. ds connectColor: Color blue. ds moveDotInFront. “<<< The new thing" b add: ds.
b -=-=-=-=-=-=
Cheers, Alexandre
Cheers
Hernán
2017-02-17 19:46 GMT-03:00 Alexandre Bergel alexandre.bergel@me.com: Hi Hernán,
The attached capture is the one implemented by the method #exampledoubleCurves.
If you zoom the image you will notice the grey edge of each green and blue line. The same happens in #exampleVerticalAndHorizontalLines
Is there a way to remove it the grey around each line?
The grey outline are actually the dots.
You need to write “ds noDot” before calling “points:” Here is an example:
| b ds | b := RTGrapher new.
b extent: 300 @ 200.
ds := RTData new. ds noDot. ds points: (-50 to: 100 by: 0.1). ds y: [ :x | (0.1 * x) sin ]. ds noDot. ds interaction popupText: 'sinus'. ds connectColor: Color blue. b add: ds.
ds := RTData new. ds noDot. ds points: (-50 to: 100 by: 0.1). ds y: [ :x | (0.1 * x) cos ]. ds noDot. ds interaction popupText: 'cosinus'. ds connectColor: Color red. b add: ds.
b addDecorator: RTHorizontalTickLineDecorator new. b addDecorator: RTVerticalTickLineDecorator new.
^ b Which produces: <Screen Shot 2017-02-17 at 7.44.55 PM.png>
I have updated these example. Indeed, there is no good reason of having the dots.
Alexandre
Cheers,
Hernán
<grey_line.png>_______________________________________________ Moose-dev mailing list Moose-dev@list.inf.unibe.ch https://www.list.inf.unibe.ch/listinfo/moose-dev
-- _,.;:~^~:;._,.;:~^~:;._,.;:~^~:;._,.;:~^~:;._,.;: Alexandre Bergel http://www.bergel.eu ^~:;._,.;:~^~:;._,.;:~^~:;._,.;:~^~:;._,.;:~^~:;.
Moose-dev mailing list Moose-dev@list.inf.unibe.ch https://www.list.inf.unibe.ch/listinfo/moose-dev
Moose-dev mailing list Moose-dev@list.inf.unibe.ch https://www.list.inf.unibe.ch/listinfo/moose-dev
-
 Alexandre Bergel
 -
 Hernán Morales Durand