
Hi Hernan
Try the next piece of code and tell me what you think
| b data |
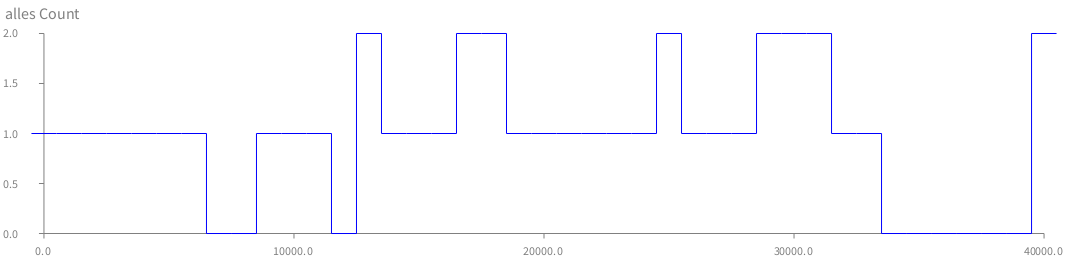
data := (0 to: 40000 by: 1000) collect: [:n | n@ (Random new next * 3) floor]. b := RTGrapher new. b extent: 1000@ 200. ds := RTData new. ds dotShape rectangle height: 1; width: 25; color: Color blue. ds connectUsing: (RTLine new color: (Color blue); width: 1; withHorizontalAttachPoint; yourself). ds points: data; x: #x; y: #y.
b add: ds. b axisX. b axisY title: 'alles Count'. b build.
[image: Imágenes integradas 1]
Cheers, Milton
2015-11-18 17:15 GMT-04:00 Hernán Morales Durand hernan.morales@gmail.com:
Hello,
I am using Roassal2 (StephanEggermont.40) in Pharo 4. The attached picture displays a common visualization for inference of local ancestry in population genetics, I have attached what I am getting now with Grapher. Input data for such visualization is for example:
1:454 2:1488 1:2546 2:5711 1:14253 2:24411 1:31490 0:41585
(those are like Associations with key 0, 1 or 2 and value 454, 1488, ... etc)
In the attached picture
Min X is 0 and Max X is 41500
so the X axis (chromosome positions) is rendered in intervals between 10000.
This is what I am trying now (code is commented where I tried to configure X axis interval)
| b intv |
intv := 0 to: 40000 by: 10000. b := RTGrapher new.
ds := RTStackedDataSet new. ds dotShape color: Color red. ds points: #(1 2 1 2 1 2 1 0); x: intv. "????" ds barShape width: 99; color: Color red. "b minX: 0; maxX: 41500." b add: ds. b axisX noLabel; noTick. b axisY noDecimal. b build.
I have some questions:
- There is support to add an interval label to the X axis but preserving
the space relation with the real chromosome position (the X axis) for the data (points in my example = 454 1488 2546 5711 14253 24411 31490 41585)?
- How to clear the bar filling?
Any advice or help would be really nice.
Hernán
Moose-dev mailing list Moose-dev@list.inf.unibe.ch https://www.list.inf.unibe.ch/listinfo/moose-dev