
Hi guys,
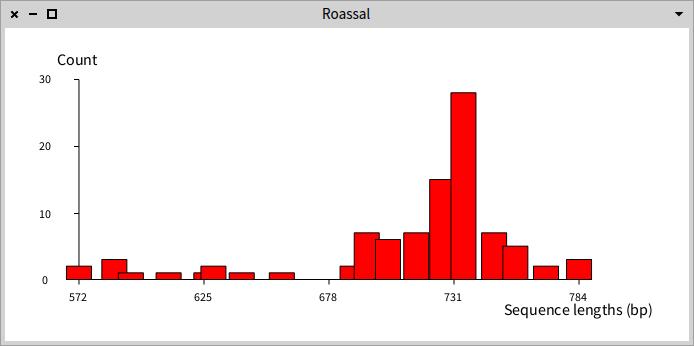
I am experiencing a problem visualizing histograms in Roassal with Pharo 5. In the attached image you can observe the first bar shape starts from a negative X axis value, where I want to start from 0. Besides, some bars are gapped but I don't know why.
I am using with the following code:
| bins minPoint g ds |
bins := self groupedBySeqLengthDistribution: binNumber. minPoint := ((bins reject: #isEmpty) detectMin: [ : c | c size ]) anyOne size.
" Build diagram " g := RTGrapher new extent: 500 @ 200; minX: minPoint; withoutOrigin; yourself. ds := RTData new points: bins; x: [ : c | c ifEmpty: [ minPoint ] ifNotEmpty: [ : d | d anyOne size ] ]; y: #size. ds barShape borderColor: Color black; color: aColor; width: barWidth. g add: ds.
" Configure axis settings " g axisY title: axixYLabel; color: Color black; noDecimal. g axisX noDecimal; fromPoint: minPoint; color: Color black; title: axisXLabel. " Open visualization in a new window " g open.
Any idea what I am missing?
Cheers,
Hernán